Project Info
Inspiration
As an SRE and DevOps Architect, I have seen on-call engineers lose valuable time during production incidents by switching between five or more tools to understand what went wrong. The evidence is usually available, but it is scattered across logs, metrics, deployment history, alerts, and previous incident reports. Bringing that information together manually slows down triage, increases alert fatigue, and often depends on knowledge held by a few experienced engineers. This experience inspired me to build a tool that brings the relevant signals together and helps teams investigate incidents more quickly and consistently.
What it does
OpsPilot is a conversational incident-response copilot demonstrated in a controlled Kubernetes test environment. The environment runs sample services and reproduces two realistic incidents: a bad configuration rollout that causes a spike in checkout errors, and a memory leak that results in an OOMKill and crash loop. Although the incidents are intentionally triggered for the demonstration, the Kubernetes events, pod logs, deployment history, and Prometheus metrics are generated by the running environment and investigated in real time. When an alert is raised, OpsPilot begins an automated investigation. It gathers evidence from the cluster, compares the timing of errors with recent deployment activity, and presents a root-cause conclusion with cited evidence and a confidence level. It then recommends an action from an approved list, such as restoring a known-good configuration, restarting a workload, or scaling a workload. OpsPilot never changes the environment without the engineer's approval. Every proposed action must come from an allowlisted set, pass a Kubernetes server-side dry-run preview that shows the exact change, receive explicit human confirmation, and be recorded in an append-only audit trail. After the action is applied, an independent verifier — not the model — confirms that error rates and workload health have returned to their defined baseline. The same investigation tools are available through a conversational interface. An on-call engineer can ask questions such as, "What evidence supports the current root-cause hypothesis?" or "What changed before the incident?" OpsPilot answers using current evidence from the test environment, without requiring the engineer to write PromQL or switch between kubectl commands. When evidence is missing, it says so and states what it needs — it does not invent logs, traces, or impact. Once the incident is resolved, OpsPilot drafts a structured postmortem from the persisted audit trail: summary, timeline, root cause with its evidence, actions taken, verification result, and prevention recommendations — with explicit unknowns rather than invented details.
How we built it
Codex was my implementation partner throughout the week: it built the FastAPI backend and React/TypeScript console with me, wrote the Kubernetes and Prometheus adapters, implemented the remediation safety contracts, and wrote most of the test suite (59 passing tests). The Kubernetes simulation — a kind cluster with a sample checkout service, Prometheus, and a load generator — was also scaffolded and debugged with Codex. GPT-5.6 is the investigation runtime, called through the OpenAI Responses API with bounded, read-only function tools. It receives typed evidence — workload status, events, log excerpts, metric queries, deployment history — decides what is relevant, and returns a structured, evidence-cited conclusion. A recorded live GPT-5.6 investigation of the checkout incident identified the injected failure mode and cited its supporting evidence. Cluster changes are always executed by application code behind the human approval gate, never by the model. Stack: Python, FastAPI, React, TypeScript, Kubernetes (kind), Prometheus, SQLite, OpenAI Responses API.
Challenges we ran into
The most interesting challenge was making automation trustworthy. Early on I assumed restarting or scaling would clear the memory-leak scenario — testing proved it would not, so I added a dedicated allowlisted restoration action instead of letting a plausible-but-wrong fix ship. Recovery verification had a similar lesson: a rollout that is still becoming ready is not a failed fix, so the lifecycle had to distinguish "still monitoring" from "verification failed." And keeping every public claim tied to tested evidence required real discipline — the project maintains a claim-verification ledger, and anything not demonstrated is stated as not demonstrated.
Accomplishments we're proud of
The complete loop works end to end in a local Kubernetes test cluster: alert → automated investigation → evidence-cited root cause → dry-run preview → human-approved fix → independently verified recovery → audit-derived postmortem. Every conclusion links to its evidence, and no change ever happens without explicit approval.
What we learned
Agents work best with small, deterministic tools instead of unrestricted commands. GPT-5.6 is most effective for reasoning and explanation, while application code handles execution and safety. Sharing the same tools between the automated investigation and the chat interface made the system simpler, more consistent, and easier to trust.
What's next
for OpsPilot Prometheus Alertmanager integration (the ingress already accepts its webhook format), a hosted demo, integrations with PagerDuty and Datadog, searchable learnings from past postmortems, and multi-cluster support.
OpsPilot
Evidence-first incident response for Kubernetes, with human-approved remediation.
OpsPilot is a conversational SRE copilot for the OpenAI Build Week Developer Tools track. It brings Kubernetes events, logs, metrics, and deployment history into one incident investigation, helping on-call engineers understand what changed, assess impact, and decide on a safe response.
Demo: Watch the 2-minute 48-second walkthrough on YouTube
Current build
The local demonstration includes:
- a FastAPI health endpoint and Alertmanager generic-webhook v4-compatible scenario ingress;
- delivery-retry, alert-update, resolved-signal, and reset/new-run idempotency behavior backed by SQLite;
- typed, bounded Prometheus and Kubernetes workload-status adapters;
- typed Kubernetes event, redacted log-excerpt, and deployment-history adapters;
- server-owned lifecycle transitions, persisted alert evidence, and an evidence timeline;
- a server-owned action plan with a Kubernetes dry-run preview, evidence binding, explicit approval, fingerprint and target-version staleness checks, and an append-only audit trail;
- an independent recovery verifier that checks workload readiness, a bounded checkout 5xx recovery indicator, and observed post-recovery 2xx traffic for P1;
- an evidence-backed incident command center with current Prometheus rates, workload health, Kubernetes events, deployment history, evidence timeline, follow-up investigation input, approval controls, and an audit-derived postmortem draft; unknown blast radius, SLO, and model confidence are shown explicitly rather than inferred;
- a five-second refresh of the controlled dashboard and a bounded evidence collection step before every investigation request; unchanged event and deployment records are deduplicated while fresh telemetry is retained;
- a real local kind environment with a checkout service, Prometheus, and a load generator;
- P1: a controlled checkout rollout that changes live traffic from HTTP 200 to HTTP 500, produces Prometheus 5xx telemetry, and recovers after reset;
- local rehearsal controls that create or reopen the matching P1/P2 incident from the console. They modify only the dedicated demo checkout workload and retain the same preview, approval, audit, recovery, and RCA gates as the command-line path; and
- an auto-refreshing local on-call queue backed by persisted incident records.
The console starts with an explicit selection screen; a reviewer can choose a
retained local incident, inject P1/P2, or open
?incident=<id>as a reproducible deep link.
The GPT-5.6 investigation route is contract-tested and has been exercised once against the direct OpenAI API in the controlled P1 scenario. That report cited persisted alert, Kubernetes, deployment, and Prometheus evidence, and its conclusion is retained with the incident record. This is evidence for that controlled P1 run only; it is not a claim that OpsPilot has been validated on production workloads or arbitrary incidents.
How Codex and GPT-5.6 are used
Codex was used as the implementation partner for the FastAPI/React scaffold, Kubernetes simulation controls, remediation safety contracts, test coverage, and the console. The project records those factual implementation sessions in its private development log rather than reconstructing them for submission.
GPT-5.6 is the configured user-facing investigation runtime. Its bounded, read-only evidence/tool contract is implemented and tested. One direct GPT-5.6 Terra investigation has been recorded for the controlled P1 scenario; the report cites persisted evidence and is included in the audit-derived RCA. The product makes no broader accuracy, automation, or production-readiness claim from that single run.
Why OpsPilot
During an incident, the important signals are usually available but split across multiple tools. OpsPilot does not replace Kubernetes, Prometheus, or an on-call engineer. It brings evidence together into one investigation and keeps every change behind an explicit approval gate.
The product is designed around four principles:
- Evidence before conclusions. Every hypothesis links to the logs, metrics, events, or deployment change that supports it.
- Constrained remediation. The model cannot run arbitrary commands. It may recommend only allowlisted actions with typed inputs and preflight checks.
- A human stays accountable. Every allowlisted remediation operation requires explicit approval from the engineer.
- Recovery must be demonstrated. An action is not marked successful until health checks and relevant service indicators return to their defined baseline.
Scenario design
OpsPilot is organized around two representative Kubernetes incident scenarios. When a scenario runs, its logs, events, deployment history, and metrics are generated by the local environment.
| Incident | Trigger | Expected investigation | Approved recovery |
|---|---|---|---|
| P1: checkout degradation | Controlled response-mode rollout | Link the 5xx increase to the recent deployment revision | Restore the controlled response mode and verify error-rate recovery |
| P2: workload instability | Controlled memory leak | Link restarts and OOMKill events to the affected workload | Restore the controlled memory mode; verify readiness and a stable restart count for 30 seconds |
Product flow
flowchart LR
    A[Scenario alert payload or engineer question] --> B[Evidence collection]
    B --> C[Evidence graph and hypothesis ledger]
    C --> D[Root-cause explanation]
    D --> E{Approved action?}
    E -->|No| F[Continue investigation]
    E -->|Yes| G[Policy and preflight checks]
    G --> H[Execute allowlisted action]
    H --> I[Verify recovery]
    I --> J[Structured postmortem]
Direct GPT-5.6 validation
- Completed, controlled P1: “What evidence supports the current root-cause
hypothesis?” The persisted report identified the controlled
FAIL_MODE=truesetting on checkout revision 158, cited its available evidence, and explicitly requested logs or a trace for direct execution-path confirmation.
Broader service ranking and blast-radius answers remain architecture targets, not current submitted-build claims.
Supported platforms
- Windows 11 / PowerShell 7: verified with Docker Desktop, kind, kubectl,
Python 3.12, Node 20, npm, and
uv. - macOS and Linux: expected to work with equivalent Docker, kind, kubectl, Python, Node, and PowerShell tooling, but not yet verified.
- The demo targets only the dedicated local
opspilot-devkind cluster; it does not support external or production Kubernetes clusters.
Local prerequisites
- Docker Desktop with Kubernetes-compatible containers enabled
kindandkubectl- Python 3.12+ and Node.js 20+
- For the final live validation and demo recording: an OpenAI API key with billing and access to the configured GPT-5.6 model
Copy .env.example to .env and add local configuration there. Credentials are
never committed to the repository.
Run locally
The commands below are verified on Windows PowerShell with Docker Desktop, kind,
kubectl, Python, Node, npm, and uv.
uv sync --all-groups
.\scripts\verify.ps1

# Starts the dedicated local kind cluster, checkout service, Prometheus, and load generator.
.\scripts\scenario.ps1 create

# In a separate terminal, start the API and its local Prometheus connection.
.\scripts\run-console.ps1
In another PowerShell terminal, exercise P1 and create its controlled scenario alert:
.\scripts\scenario.ps1 inject-p1
.\scripts\send-p1-alert.ps1
.\scripts\scenario.ps1 reset-p1
.\scripts\scenario.ps1 status

# Runs the controlled P1 integration test against kind, then resets the scenario.
.\scripts\test-e2e-p1.ps1

# Runs the complete controlled P1 approval/recovery path against kind. It starts
# a temporary local Prometheus port-forward and resets the scenario afterward.
.\scripts\test-e2e-p1-remediation.ps1
create uses only the dedicated opspilot-dev kind cluster. The scenario commands
intentionally modify the checkout deployment in its opspilot-demo namespace;
they do not target an external cluster.
Alternatively, open http://127.0.0.1:5173 after starting the API and use the
rehearsal selector and Inject P1 incident button beside Open. Select P1 to
create a new triaging incident and change only the checkout response mode. Wait
for the five-second dashboard refresh to show the live 5xx trend, then use the
normal dry-run, approval, recovery, and RCA controls. Reset restores the two
controlled scenario toggles; it does not approve or execute a remediation.
For a clean local rehearsal before a screenshot or recording, run:
.\scripts\prepare-demo.ps1 -ClearIncidentHistory
This stops only the local OpsPilot API if it is running, resets the controlled
workload, deletes only the ignored local SQLite history at artifacts/opspilot.db,
then restarts the API in its previous mode. It does not touch a Kubernetes cluster
outside the dedicated demo environment.
Clean local UI rehearsal
Use this sequence when an old browser tab, API process, or retained incident is making the console confusing. It intentionally leaves the console with no active incident; inject a scenario from the UI rather than reading telemetry for an unselected record.
# Reset the dedicated demo workload and ignored local incident history. This
# command stops and restarts only the local OpsPilot API when necessary.
.\scripts\prepare-demo.ps1 -ClearIncidentHistory

# Keep this terminal open. Reports are deterministic local evidence summaries
# for UI rehearsal and are visibly labelled; they are not GPT-5.6 outputs.
.\scripts\run-console.ps1 -ControlledSimulation
In a second terminal, run cd frontend; npm run dev, then open
http://127.0.0.1:5173. Confirm the API mode before starting a rehearsal:
Invoke-RestMethod http://127.0.0.1:8000/healthz
# Expected: status = ok; investigation_mode = controlled_simulation
Click Inject P1 incident, wait for the five-second refresh and telemetry trend, then choose Investigate. Investigation is read-only and intentionally keeps the lifecycle in Triaging. Create a dry-run preview to move it to Action Proposed, explicitly approve the exact plan, execute it, verify recovery, and then draft the RCA. Use Reset environment only to turn off the two injected failure modes; it does not delete incident records.
For a repeatable non-UI P1 safety check using the same controlled report mode:
.\scripts\test-e2e-p1-remediation.ps1 -SimulationInvestigation
This wrapper exercises the full P1 path—inject, deterministic investigation, dry-run, human approval contract, execution, independent recovery verification, and scenario reset. It is a local rehearsal check, not evidence of a live GPT-5.6 run.
For the credential-free prebuilt-image reviewer path, see JUDGE_PATH.md.
For a complete controlled on-call walkthrough—from starting P1/P2 through evidence review, approved remediation, independent verification, and RCA—see the on-call rehearsal guide.
Recorded controlled walkthrough
These screenshots were captured from controlled local P1 and P2 runs. The Kubernetes workload, Prometheus telemetry, alert payload, approval history, and recovery result are all from the demo environment. Each screenshot is one decision point, not a long browser capture.
-
Start from an explicit selection screen; the console does not show unrelated telemetry until a reviewer injects or opens one incident record.
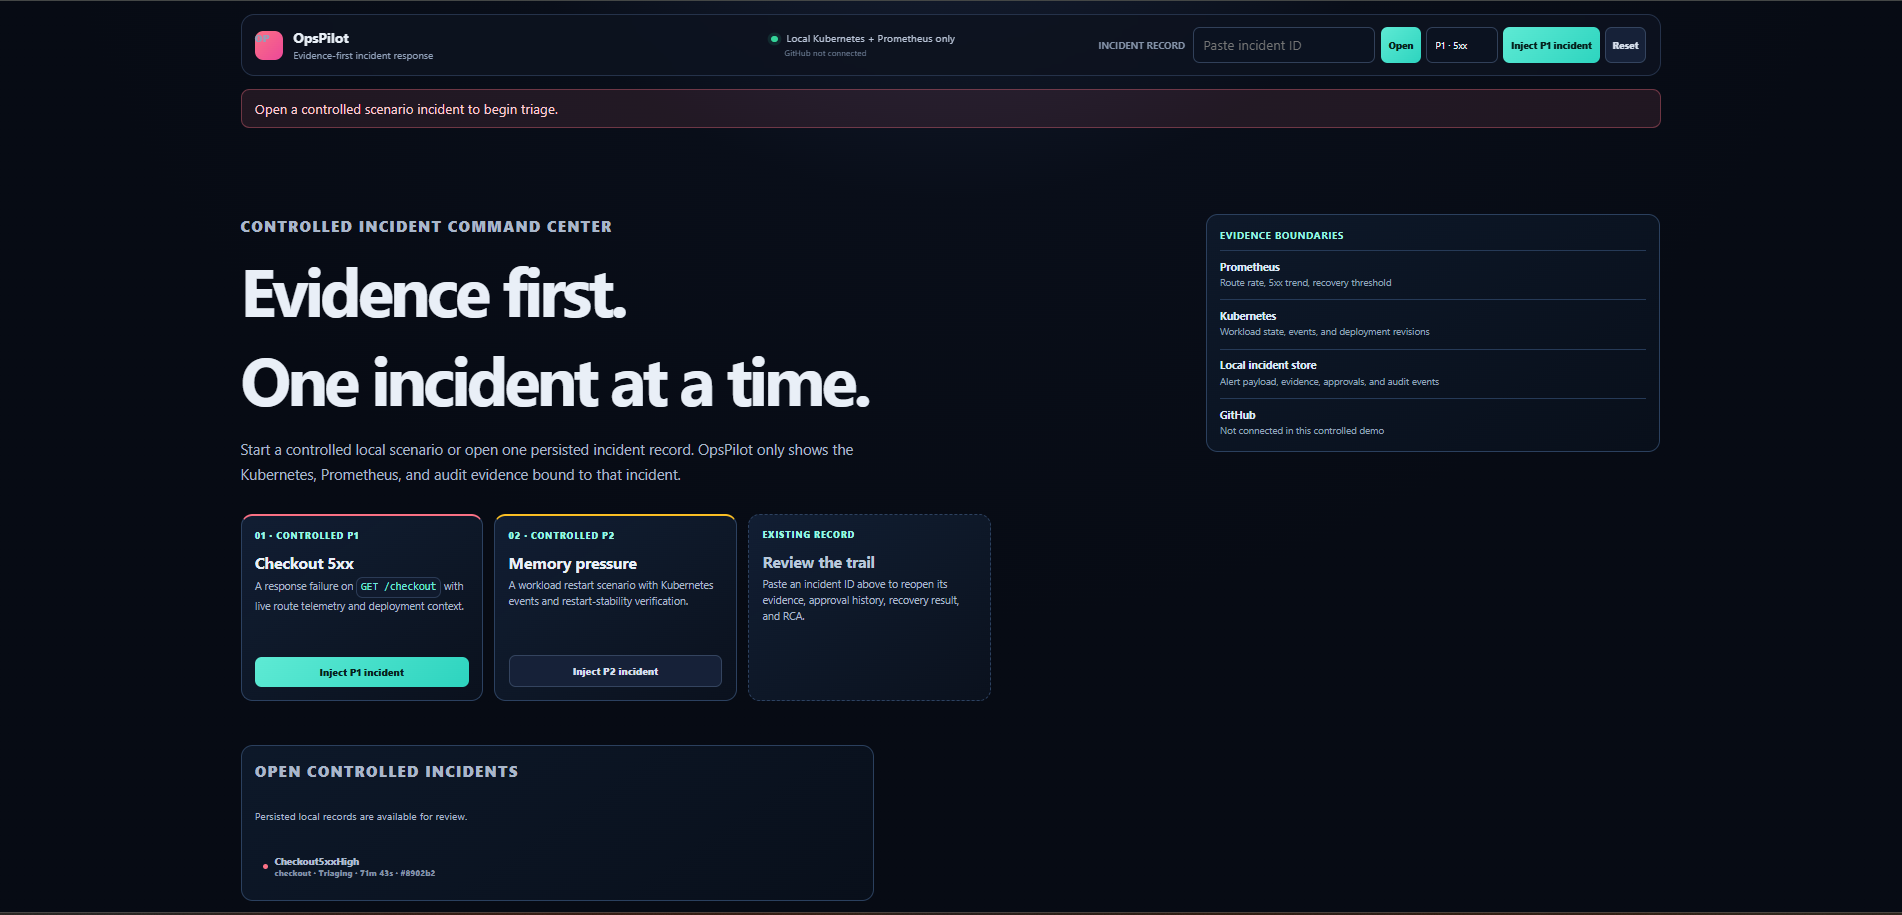
Source / choice Meaning Controlled P1 Starts the checkout GET /checkout5xx scenario.Controlled P2 Starts the memory-pressure / restart-stability scenario. Prometheus Route rate, 5xx trend, and recovery threshold. Kubernetes Workload state, events, and deployment revisions. Local incident store Alert payload, evidence, approvals, and audit events. GitHub Explicitly not connected in this controlled demo. -
Review a fresh active P1 record. The dashboard names the affected route, its rate window, workload state, recovery gate, source boundaries, Kubernetes events, deployment history, follow-up controls, and incident trail in one wide console frame.
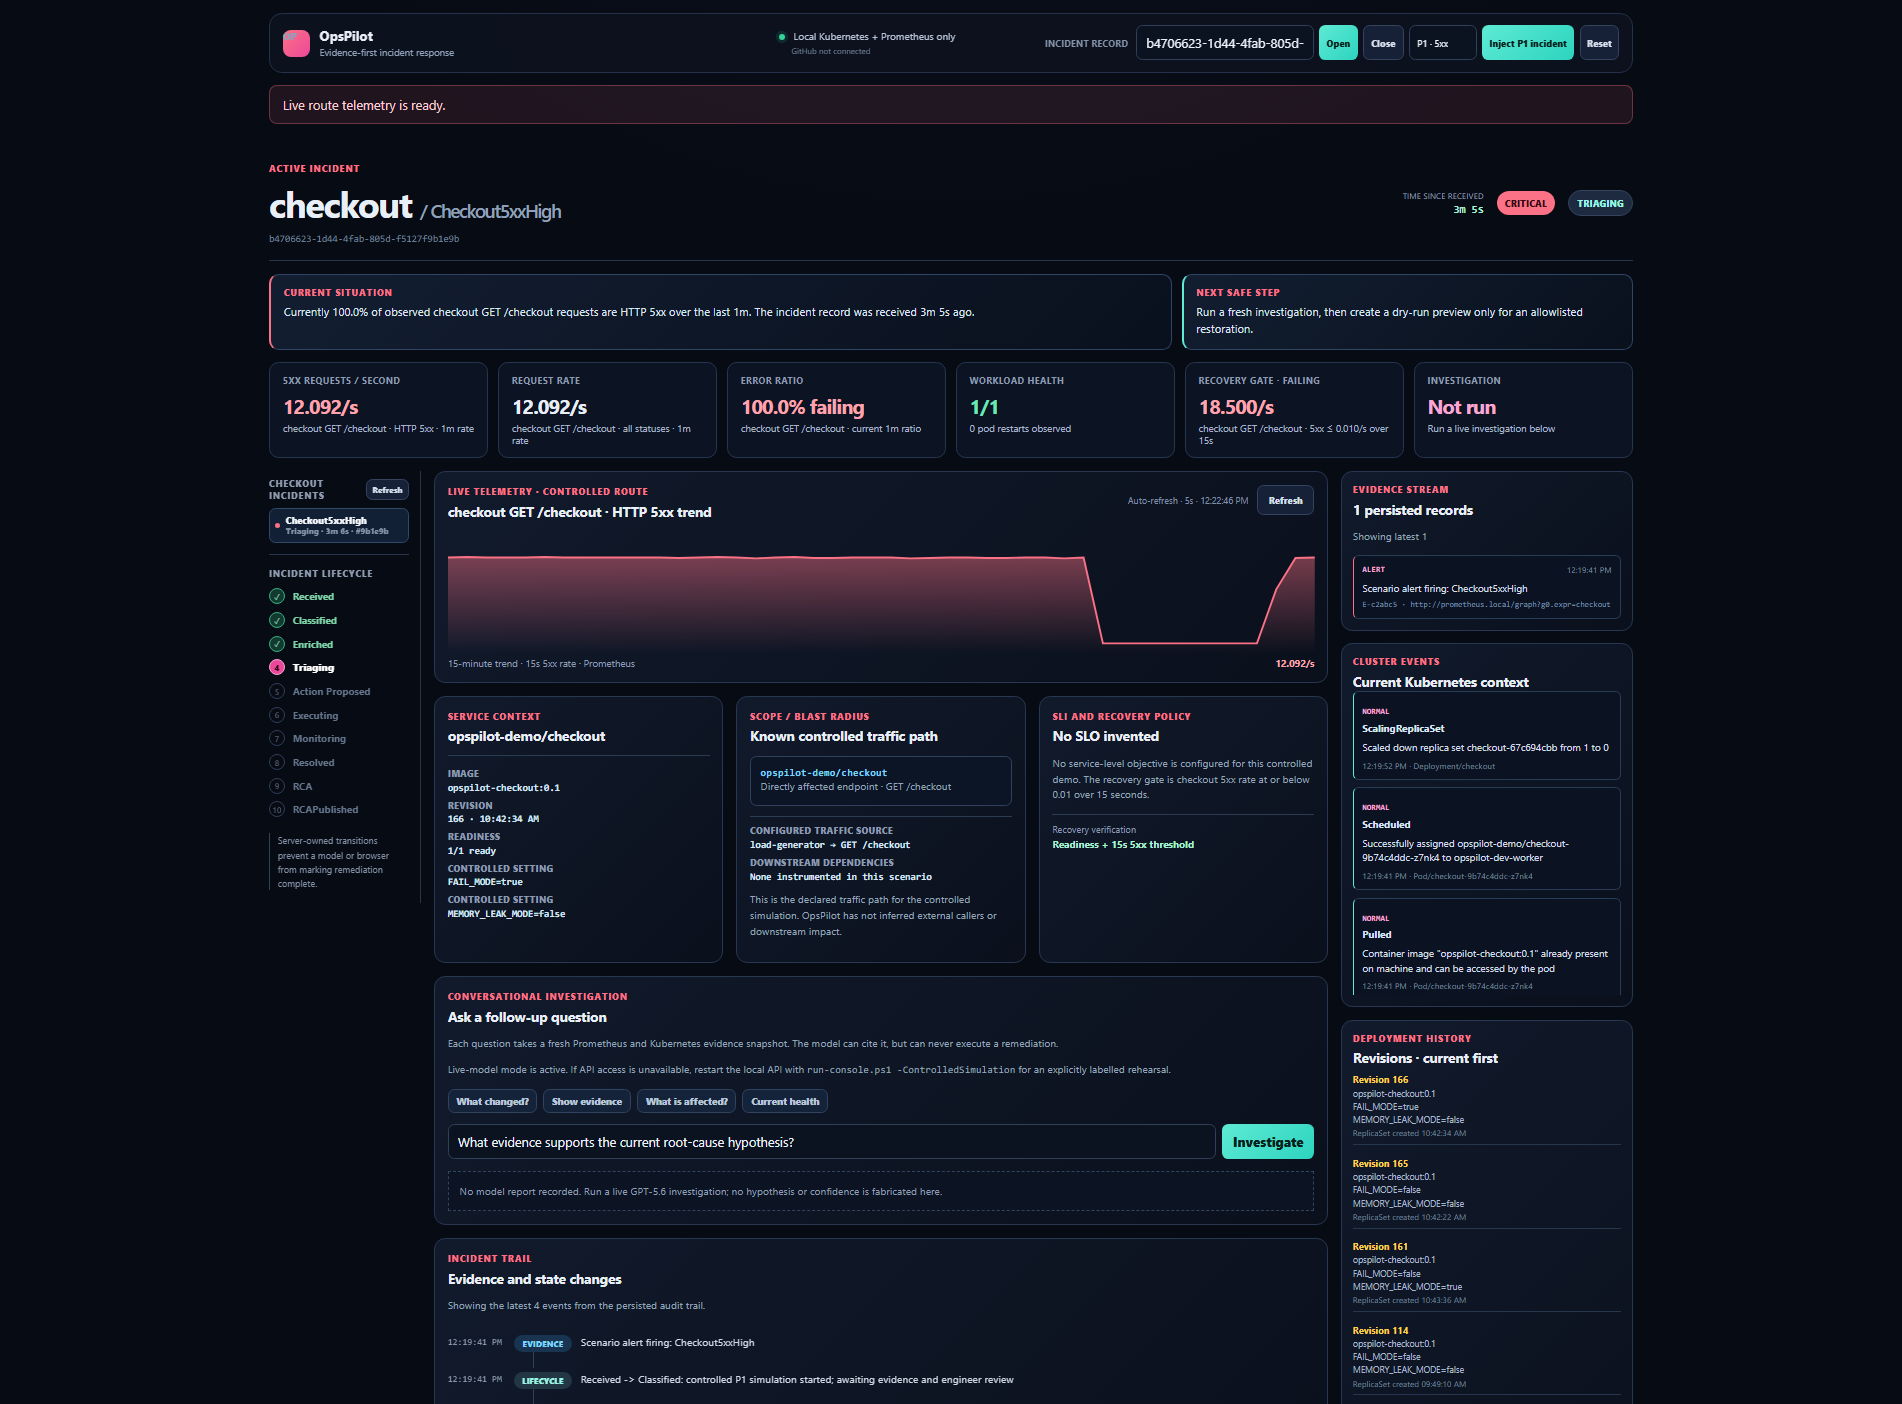
This captured P1 record is in Triaging. The cards always identify the same route:
checkout GET /checkout.Value Meaning in this captured record 5xx / second: 12.092/sObserved HTTP 5xx rate for the controlled route. Request rate: 12.092/sAll-status, one-minute rate for that route. Error ratio: 100.0%Current one-minute 5xx ratio. Workload health: 1/1Ready replicas / desired replicas. Recovery gate: failing 5xx must fall to 0.010/sor below for 15 seconds.Investigation: not run The prompt is ready; no hypothesis is fabricated before a model report exists. -
Review the P2 server-side Kubernetes dry-run. The exact proposed setting change, target, evidence binding, expiry, self-declared local approver, and rejection path are visible before anything is applied.
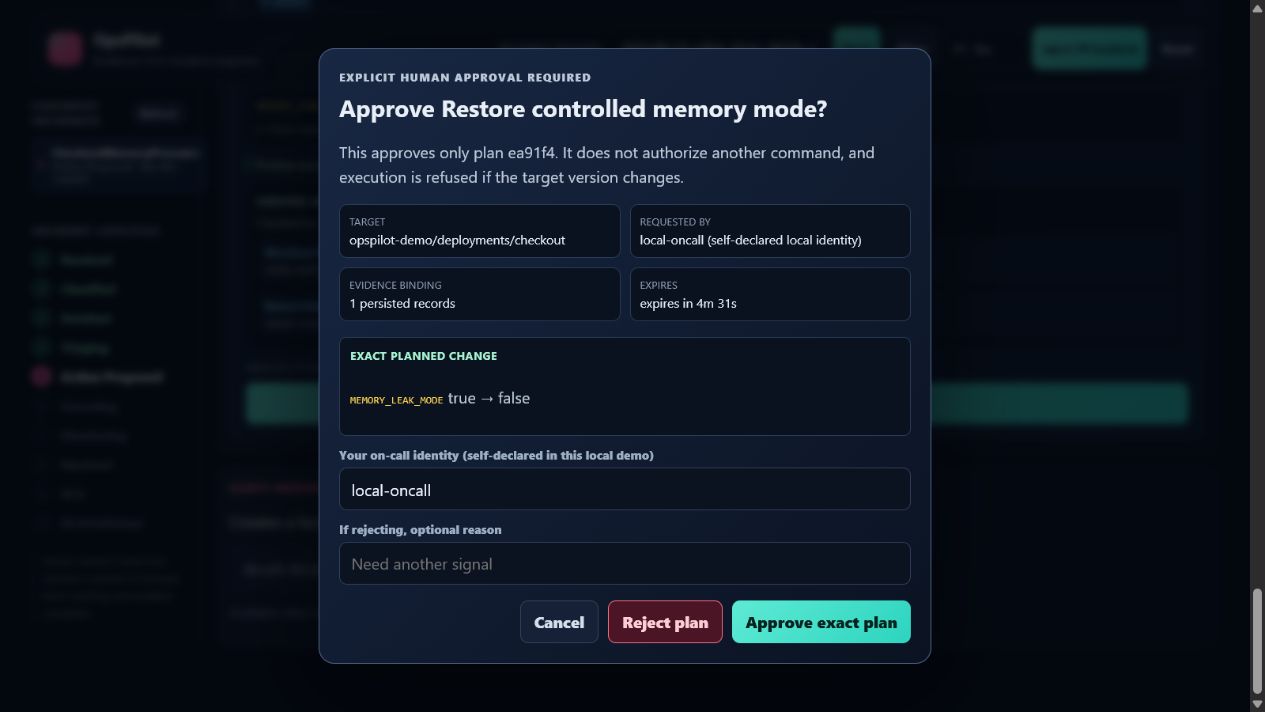
| Approval detail | Meaning |
|---|---|
| Target | Exact controlled workload. |
| Planned change | MEMORY_LEAK_MODE true → false in this P2 example. |
| Evidence and expiry | Bound to this plan; it becomes stale rather than applying later. |
| Local identity | Self-declared demo identity, retained in the audit trail. |
| Reject plan | An audited route back to triage. |
-
After explicit approval, the independent verifier confirms recovery. The RCA is assembled from persisted facts and carries the bounded live-model conclusion with its evidence identifiers.
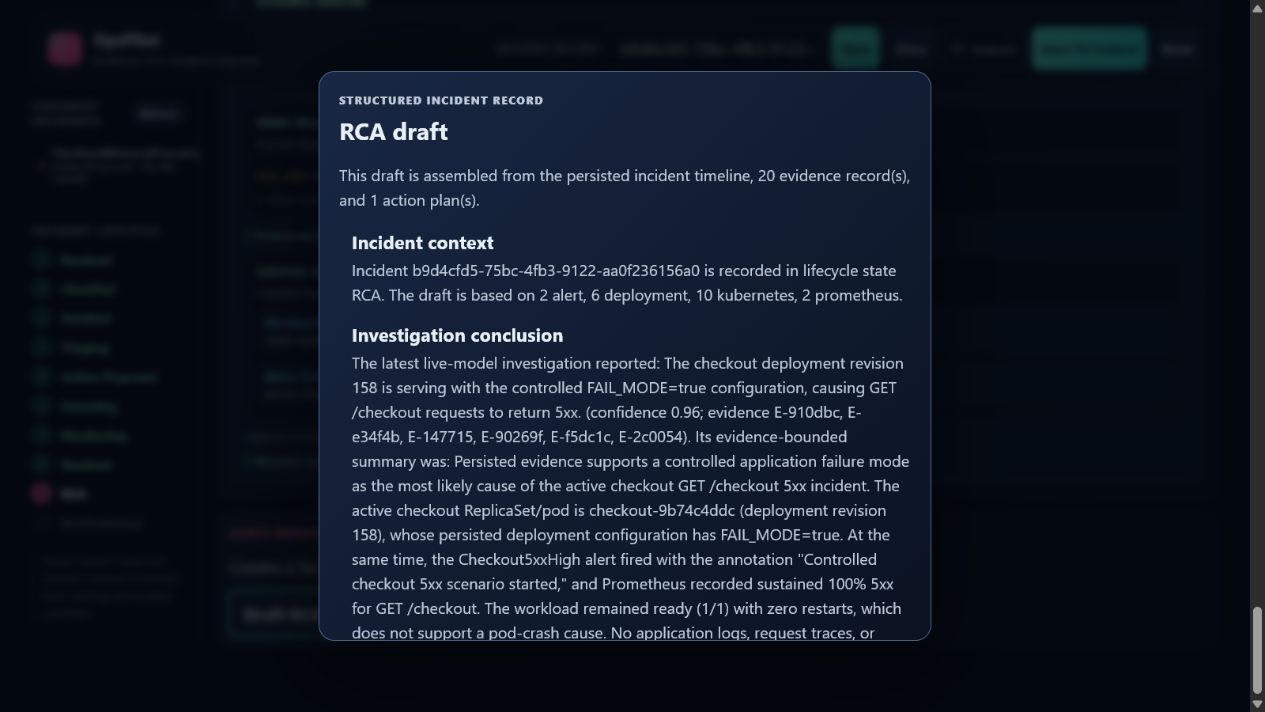
The RCA is assembled from persisted incident facts. It records the evidence count, actual source breakdown, evidence-cited investigation conclusion, and explicit unknowns rather than inventing missing logs, traces, customer impact, or external dependencies.
Recovery and scope
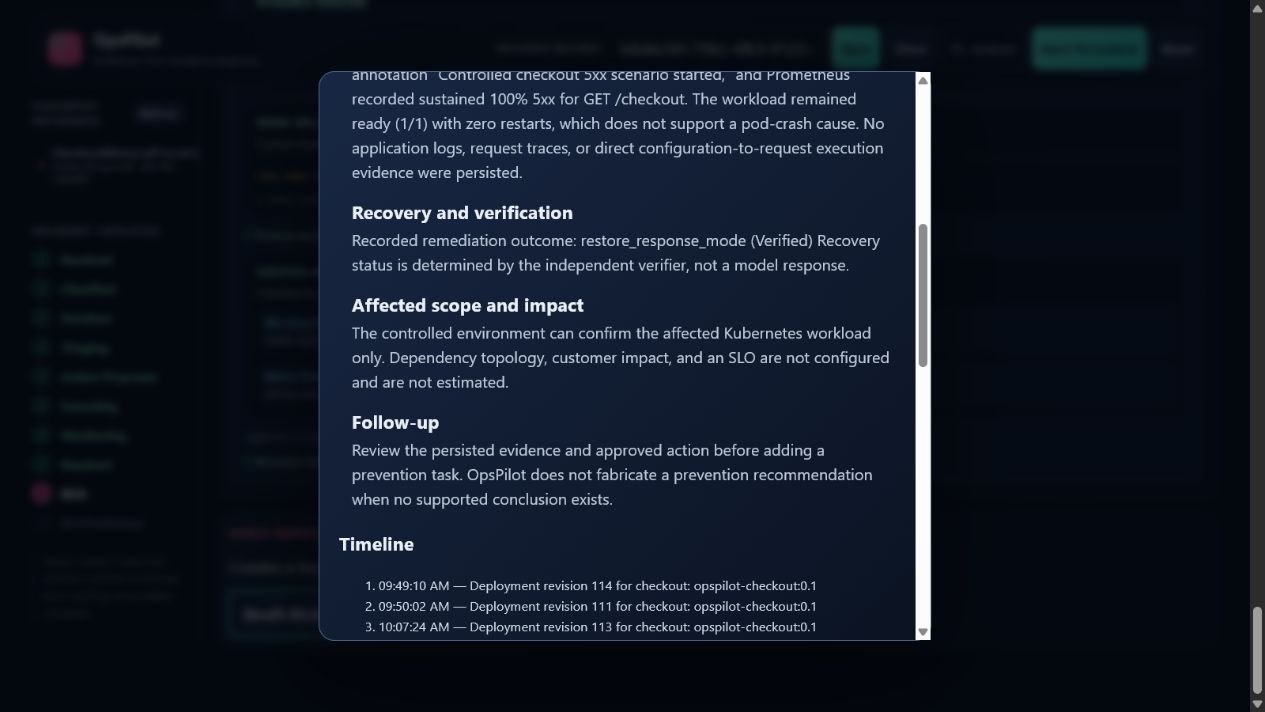
The recovery outcome and the declared scope stay separate and readable.
Timeline
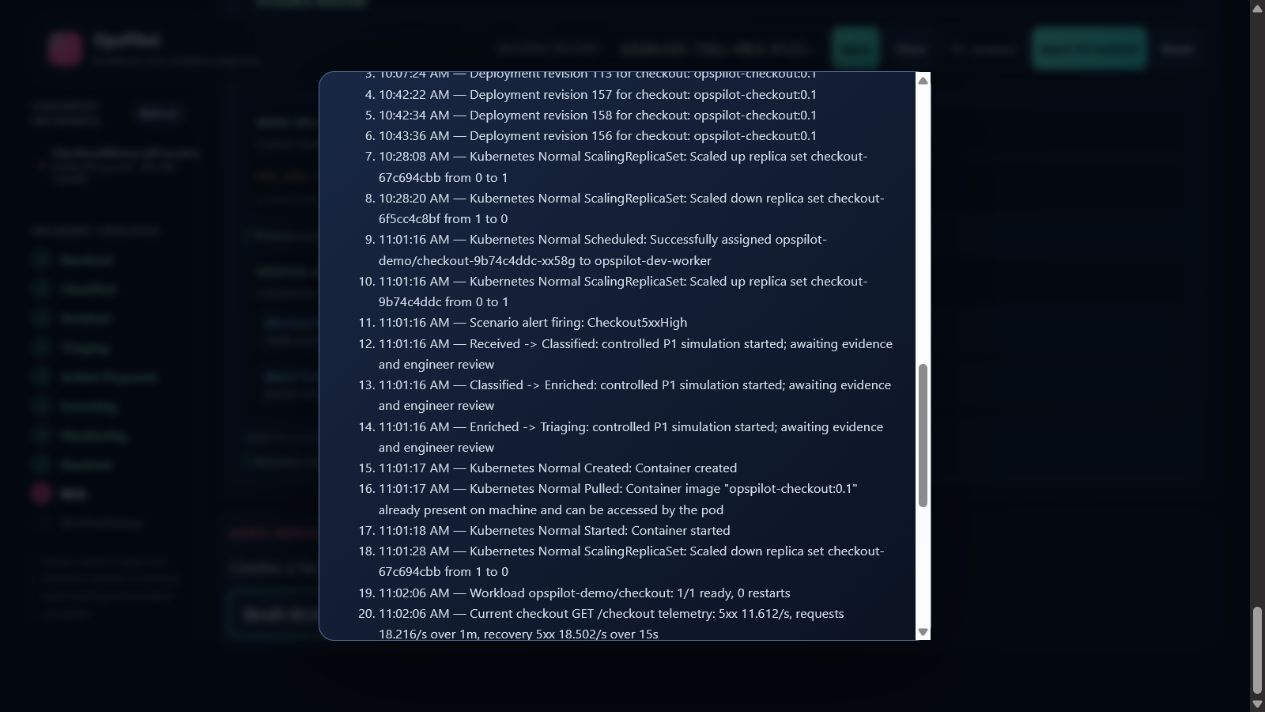
The timeline orders persisted alert, evidence, approval, execution, and verification events for this incident.
Recorded action
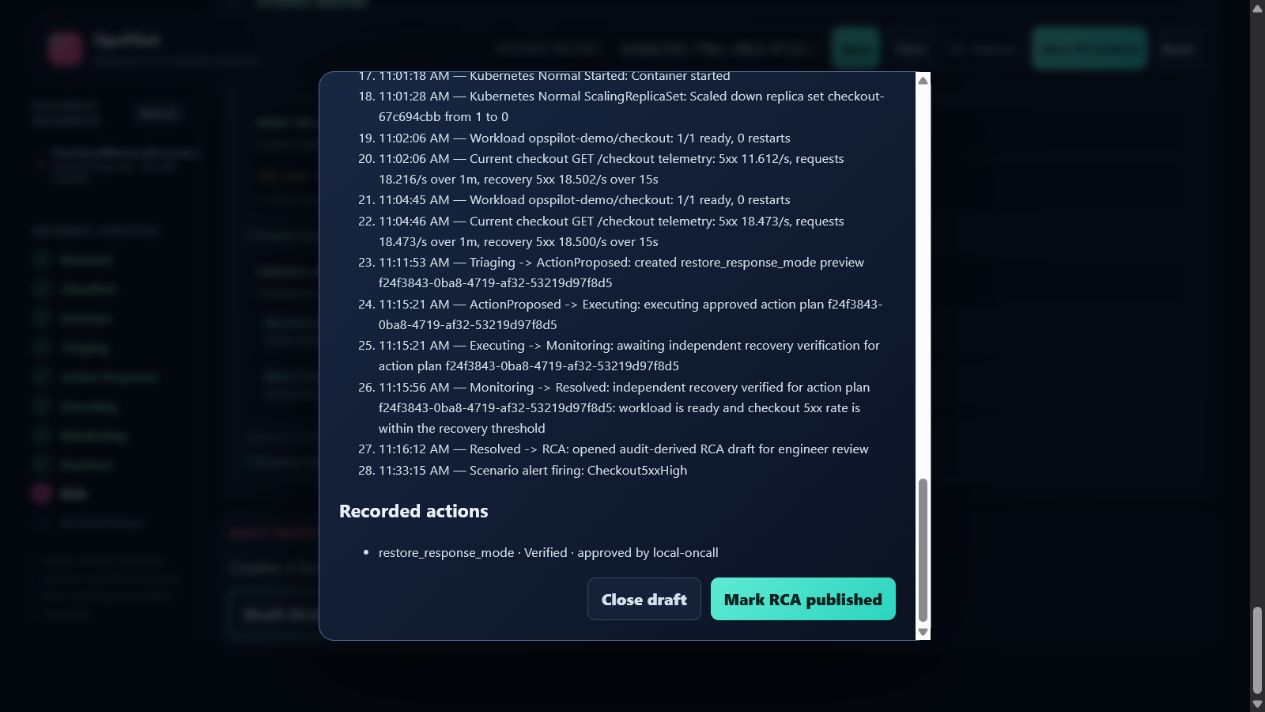
The final record distinguishes a proposed plan from an approved, applied, and independently checked action.
Development-only model provider
OpenRouter may be used for lower-cost local development experiments with a
GPT-5.6 model. Set LLM_PROVIDER=openrouter and configure the ignored
OPENROUTER_* values in .env. It is not presented as the final OpenAI
validation or recording path; restore LLM_PROVIDER=openai before those steps.
Controlled simulation rehearsal mode
If direct model access is unavailable, the local console can still exercise the complete user interface, approval, remediation, recovery, and RCA workflow with real local Kubernetes and Prometheus signals plus a deterministic evidence report:
.\scripts\run-console.ps1 -ControlledSimulation
The console labels these reports Controlled simulation — not GPT-5.6 and they are derived from persisted local evidence without calling any model. Use this mode for UI rehearsal only. It must not be presented as live GPT-5.6 reasoning in the Devpost submission or final model demonstration.
Safety model
OpsPilot is designed for a controlled Kubernetes environment. It uses typed, bounded access to Kubernetes and Prometheus rather than arbitrary shell commands or unrestricted PromQL. Proposed actions are constrained by an allowlist and require explicit engineer approval.
Analysis
View
Metric
- 10

Figures cover GitHub contributors during the hackathon window. A co-authored commit counts in full for each author, so per-member totals add up to more than the whole-team figures.
Technology
- CSSIn code
- FastAPIIn code
- HTMLIn code
- OpenAIIn code
- PythonIn code
- ReactIn code
- TypeScriptIn code
- DockerClaimed
7 of 8 appear in the indexed code. 1 claimed on Devpost could not be matched to code, which may simply mean the tool leaves no trace in the repository.
AI coding agents
No AI coding agent signals were found in this repository.
Detected from committed agent config files and commit authorship. Absence of a signal is not proof an agent was unused.
Codebase size
Source size
396 KB
Source files
52
Counts recognized source files only; vendored directories, binaries and lockfiles are excluded, so this is smaller than the repository on disk.
Repository
GuruduGanesh/sre-opspilot
84 files · 2.1 MB · @ b7ba7f1
Structure
Interface
1 file · 1%Screens, components and styles rendered to the user.
API & routing
2 files · 2%Request entry points: routes, handlers and controllers.
Application logic
30 files · 36%Domain rules, services and shared utilities.
Supporting
Layers are inferred from where files sit in the tree, not from reading the code. A project that names its directories unconventionally will read oddly here — open the file browser to check anything the diagram implies.
Languages
- Python56%
- Markdown23%
- TypeScript13%
- CSS6%
- YAML2%
- HTML0%
Share of indexed source by file size. Binary and vendored files are excluded.
Dependencies
frontend/package.json
npm · 8- @vitejs/plugin-react
- react
- react-dom
- vite
- +4 more
pyproject.toml
pypi · 7- fastapi
- httpx
- kubernetes
- openai
- pydantic
- pydantic-settings
- uvicorn[standard]
demo/checkout/requirements.txt
pypi · 3- fastapi
- prometheus-client
- uvicorn
Declared in the repository’s manifests at the indexed commit. A declared package is not proof it is used, and runtime dependencies are listed first.
This project’s features have not been analysed yet.
Export this project's context (description, README, evidence, key source files) to chat with an AI agent elsewhere.