Project Info
📄 Overview Odin constructs a knowledge graph from your (possibly handwritten) notes and compares it to a knowledge graph constructed from lecture recordings. From this, we identify lecture topics that are missing from your notes, as well as interactions between main concepts and themes. Based on these personalized knowledge graphs, Odin can also generate quiz questions at the frontier of your abilities, intended to maximize the efficiency of your study process (in accordance with psychology principles such as the Zone of Proximal Development). 💡
Inspiration
You’re in a lecture hall, fluorescent light shining harshly on the walls, the screeching sound of the chalk and the professor’s voice filling the air. They’re talking about pointers, or maybe eigenvalues, but all you can think about is the ant crawling on your friend’s hand. Should you tell them? Or is it more amusing if they don’t know? You snap out of your haze. How long has it been? 30 seconds? 5 minutes? Whatever it was, you completely missed that part of the lecture. For our team members, this scene hits close to home. As college students who attend large, fast-paced lectures, it’s often impossible to fully capture the content taught in lecture. What’s more, amid P-Sets, clubs, and spending time with friends, it’s hard to block in time to rewatch lecture recordings to see what we missed. And even if we do find the time, it’s possible that we will miss the content again. To solve this problem and make learning more efficient, we created Odin AI. In Norse mythology, Odin sacrificed his eye to see everything that happens in the world. In the same way, Odin AI superpowers your studies, providing visualization and analysis tools that ensure you never miss a topic again! ⭐
What it does
Simply upload a photo of your handwritten notes from class and a recording from lecture, and let the magic happen. Odin AI will compare your understanding with the ground truth of the lecture recording and construct a personalized graph with sample questions to help you study. With a graph to easily visualize class concepts, you can see how different ideas relate to each other, as well as areas to keep focusing on. As you keep practicing, your graph will evolve to reflect your mastery. No notes? No recording? No worries, Odin doesn't need both. Upload what you have, and Odin AI will still generate a study plan and a concept map. Summary of our main features: Concept graph generation from images of your notes Concept graph generation from recordings of your lectures Personalized quiz question generation based on your concept graph(s) Inspect concept details and connections to other concepts Graph visualization that represents concept relationships (red is closer to lecture material, purple is closer to your notes, edge and node sizes are scaled according to importance, etc.) Automatic and persistent saving of your past graphs, so you can review old content anytime! 🤖
How we built it
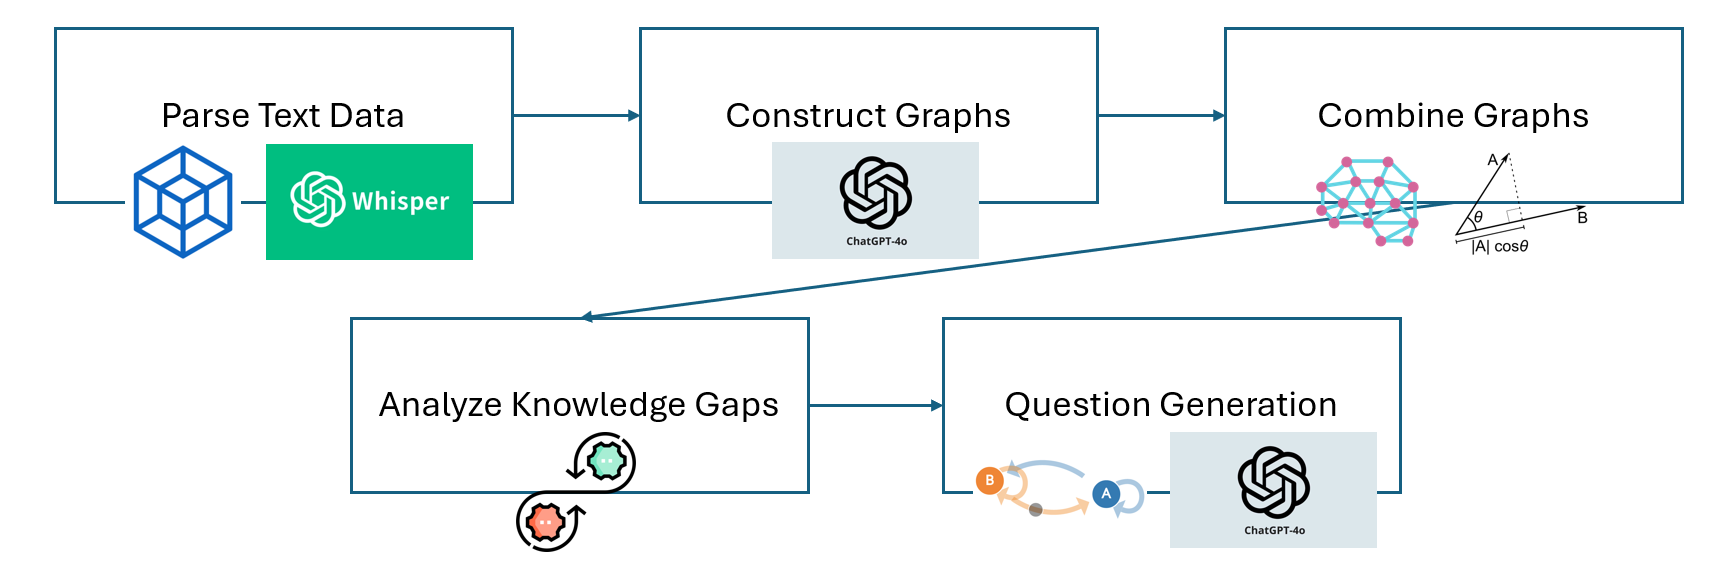
This project heavily leveraged multimodal foundation models and fast-inference AI systems, as well as classical algorithms, to cohesively merge together our multiple data sources. Odin includes the use of Optical Character Recognition (OCR) via Tesseract, Speech-to-Text Transcription via Whisper, Large Language Model prompting via OpenAI API, Markov chain traversals, and self-designed graph algorithms. Our web application is built with React.js with Material UI styling. We use Reagraph for graph visualization. Step 1: Parse Text Data Once a .png of handwritten notes or a .mp3 of a lecture recording is uploaded, we process the different data sources and generate transcriptions of each. We use Tesseract for OCR on handwritten notes, and Whisper for transcription on lecture recordings. We run these initial texts through a "markdown transform" LLM prompt which adds organization and corrects spelling mistakes in the initial transcripts. Step 2: Construct Preliminary Graphs From there, we use an LLM to generate a list of key concept nodes and edges between nodes that describe their connection to each other. Now, we have two graphs: one which describes what we call our "ground truth," or the lecture recording, and the other which describes "understanding", or the handwritten notes. To calculate the importance of each concept, or node, in our graphs, we use a node centrality algorithm we created ourselves that uses metrics like node degree, BLEU score, and term frequency inverse document frequency (TF-IDF). From here, we’re able to calculate edge weights to measure how relevant the connections between two nodes are. Step 3: Combine Graphs and Analyze Knowledge Gaps Once we’ve composed these two graphs and populated them with these values, we’re ready to merge them and find the knowledge gaps! We use cosine similarity in concept embedding space to consolidate similar nodes together and update edge weights in our "understanding" graph, using an algorithm that computes a value based on adjacent nodes in the "understanding" and "ground truth" graphs. Assume that Node A, of weight a_0, connects to Node B, of weight b_0, with Edge E, of weight e_0, in our "ground truth" graph. Similarly, there is a connection of weights a_1, b_1, and e_1 in our "understanding" graph. As we merge to find gaps in understanding, we re-weight e_1 to be: e_1 = (a_1 * b_1 * e_1)/(a_0 * b_0) We now have consistency between our "understanding" and "ground truth" graph. For the final step, we compare edges between our graphs and reweight them into a personalized graph where an edge weight is (for some fine-tuned alpha): edge weight = "ground truth" weight + max(difference("ground truth" weight, "understanding" weight), 0) * alpha This formula allows us to appropriately weigh understanding with the importance of content. Step 4: Visualize Graph and Generate Questions From here, we use these recalculated weights to visualize our personalized graph and write focused practice questions to build mastery. Our graph color-codes nodes that belong in our "understanding" graph as purple and "ground truth" as red. Node sizes and edge thickness are also scaled to correspond to importance. To generate questions, we first conduct a Markov chain traversal on the personalized graph to identify combinations of concepts that would produce the most challenging questinos, given the user understanding. We then use an LLM to generate questions from those concepts, and update our edge weights as mastery increases. This is visualized on our graph in real time. ⛰️
Challenges we ran into
One of our main challenges arose in our multimodal transcription methods. OCR can be highly inaccurate and has a hard time deciphering a lot of handwritten text. To help smooth these discrepancies, we used an LLM to clean up our text and infer what was actually written or spoken in our files. This worked a lot better and made our model more robust towards bad handwriting and unclear audio, similar conditions one would face when uploading lecture notes and recordings. Building our graph schema was also a challenging undertaking. Rapidly adapting our structure to incorporate more features as we went along resulted in frequent merge conflicts, which took quite a bit of time to resolve. Additionally, coming up with our algorithms to calculate weightage and importance was hard to standardize and resulted in a lot of conversations where we discussed the best way to measure and visualize understanding of material. Building the graph and visualizing edge weights was difficult as well. Our graphics library (Reagraph) had inconsistent scaling on the backend, making it an arduous undertaking to change the thickness of our edges in a way that was aesthetically pleasing and representative of edge importances. We normalized our node weights, which reflected in the size of our nodes, and scaled our edge weights to demonstrate which parts of our understanding were weaker or stronger. 🚀
Accomplishments we're proud of
We are delighted at how we were able to synthesize our data from multiple sources and compare them in a meaningful way. The first time we were able to see our concept graph from just a simple image was a momentous milestone for our team, and we definitely scared the couple having lunch together at Arrillaga with our excitement. From designing effective graph algorithms and building strong agentic workflows to visualizing the data and integrating our various components, our project was a feat of engineering (with 100+ GitHub commits) which we are proud of. Most of all, we're delighted that we developed a tool that we would use on a regular basis and recommend to friends. 🦙
What we learned
We all came into this hackathon with varying levels of experience. For some of us, this was our first time using LLMs and handling complex graph visualizations. From this project, we learned so much about web development, AI transcription, graph algorithms, custom data structures, and graphics libraries. Despite the late hours, we had a lot of fun, although the energy drinks and llamas definitely helped with that. 🍓
What's next
We want to keep working on this project to build functionality for some of the code we’ve already written: diagram transcription with VLMs. Additionally, we’d like to improve our visualization capabilities, especially with regards to our edge weights. We’re excited to keep working on this and make education and learning more personalized and efficient. A few specific extension features we have in mind: Support more types of input (lecture slides, typed documents, diagrams, etc.) Generating an optimized curriculum for learning the content (use a modified topsort) Provide deeper insights on the combined graph and relationships between main concepts
Odin AI
In Norse mythology, Odin sacrificed his eye to see everything that happens in the world. In the same way, Odin AI superpowers your studies, providing visualization and analysis tools that ensure you never miss a topic again.
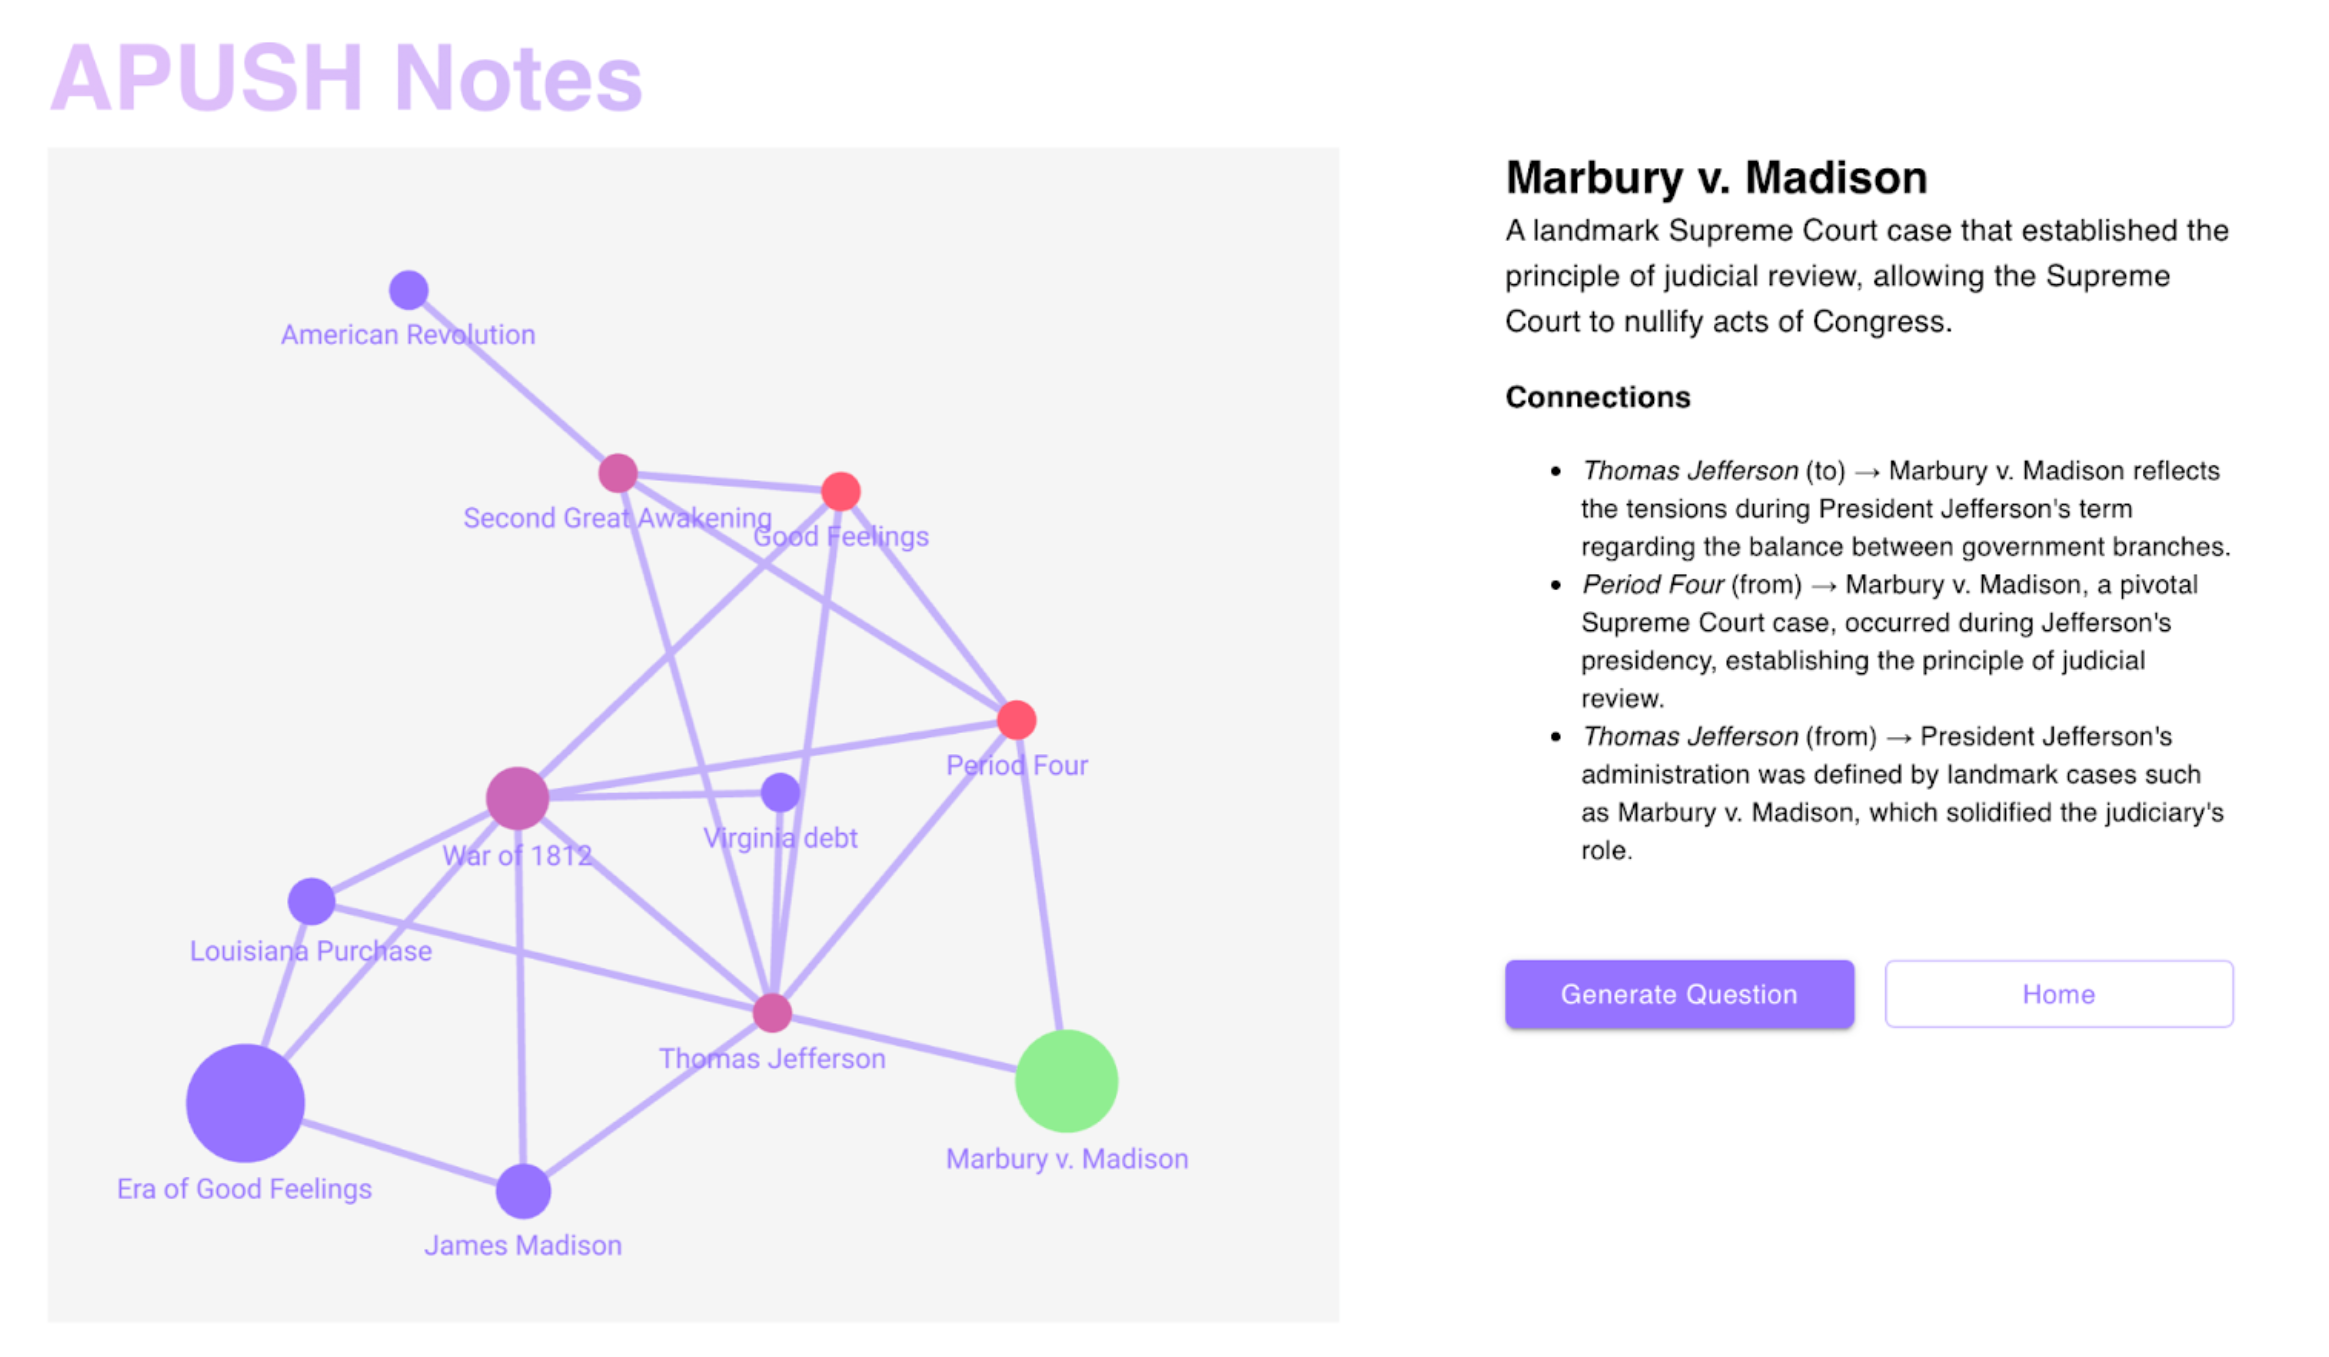
Odin constructs a knowledge graph from your notes and compares it to a knowledge graph constructed from lecture recordings. This allows easy identification of topics missing from your notes, as well as interactions between various concepts and themes. Based on your knowledge graph, Odin can also generate quiz questions at the frontier of your abilities, intended to maximize the efficiency of your study process.
Getting started
-
Install dependencies in the project directory:
npm install -
Replace the placeholders in
keys.tswith valid API keys. -
Run the following to start the development server:
npm run dev -
Open a browser and go to
localhost:5173to see the app! -
Type
Ctrl+Corqin the terminal with the server to stop the server.
How Odin Works
Odin uses a combination of classic algorithms and modern AI techniques. A rough sketch of our pipeline is depicted below.
Analysis
View
Metric
- 39
- 24
- 23
- 22


Figures cover GitHub contributors during the hackathon window. A co-authored commit counts in full for each author, so per-member totals add up to more than the whole-team figures.
Technology
- CSSIn code
- HTMLIn code
- JavaScriptIn code
- OpenAIIn code
- ReactIn code
- TypeScriptIn code
6 of 6 appear in the indexed code.
AI coding agents
No AI coding agent signals were found in this repository.
Detected from committed agent config files and commit authorship. Absence of a signal is not proof an agent was unused.
Codebase size
Source size
76 KB
Source files
37
Counts recognized source files only; vendored directories, binaries and lockfiles are excluded, so this is smaller than the repository on disk.
Repository
ML72/Odin-AI
60 files · 24.6 MB · @ 2125b24
Structure
Interface
9 files · 15%Screens, components and styles rendered to the user.
Application logic
25 files · 42%Domain rules, services and shared utilities.
Supporting
Layers are inferred from where files sit in the tree, not from reading the code. A project that names its directories unconventionally will read oddly here — open the file browser to check anything the diagram implies.
Languages
- TypeScript95%
- Markdown3%
- HTML1%
- CSS1%
- JavaScript0%
Share of indexed source by file size. Binary and vendored files are excluded.
Dependencies
package.json
npm · 47- @capacitor/android
- @capacitor/app
- @capacitor/assets
- @capacitor/core
- @capacitor/haptics
- @capacitor/ios
- @capacitor/keyboard
- @capacitor/preferences
- @capacitor/status-bar
- @emotion/react
- @emotion/styled
- @ionic/react
- @ionic/react-router
- @mui/icons-material
- @mui/material
- @reduxjs/toolkit
- @types/react-router
- @types/react-router-dom
- +29 more
Declared in the repository’s manifests at the indexed commit. A declared package is not proof it is used, and runtime dependencies are listed first.
This project’s features have not been analysed yet.
Export this project's context (description, README, evidence, key source files) to chat with an AI agent elsewhere.