Project Info
Inspiration
Markets are flooded with confident narratives — headlines that sound convincing, trend strongly on social media, and often move sentiment indicators. But as investors, we kept asking a simpler question: When does the story stop matching reality? Most sentiment tools measure how positive or negative the news is. Very few measure whether that sentiment is actually reliable when compared to real price movement. We were inspired to build a tool that doesn’t just summarize narratives, but tests them against market outcomes.
What it does
Market Atlas detects moments of false conviction — periods where headlines and sentiment are confident, but price action disagrees. For each stock, the app: Aggregates daily news sentiment Compares it to actual price returns Computes a Narrative Reliability Score over 7 / 14 / 30 days Surfaces misalignment days, where bullish narratives coincided with falling prices (or vice versa) Allows users to drill down into the actual headlines behind those failures The result is not just a score, but an auditable story: Score → Failure → Evidence
How we built it
Backend Python + FastAPI for the API layer Supabase (Postgres) for structured storage Background worker pipeline for ingestion and computation Daily jobs to: Ingest news articles Score sentiment using an ML model (with chunking to handle token limits) Aggregate daily sentiment Ingest historical and daily prices Compute rolling alignment metrics Ingest news articles Score sentiment using an ML model (with chunking to handle token limits) Aggregate daily sentiment Ingest historical and daily prices Compute rolling alignment metrics Frontend Next.js (App Router) TypeScript Material UI for fast, consistent layout A narrative-driven UI that prioritizes insight over charts Key Metric Narrative alignment is computed using: Directional agreement between sentiment and returns Strength-weighted misalignment detection Rolling windows instead of single-day noise All external data fetching happens outside the UI. The frontend only reads from the database, ensuring consistency and speed.
Challenges we ran into
Data coverage limits: Free news APIs only provide limited historical depth, forcing us to explicitly track and surface sentiment coverage. Token limits in ML models: Articles often exceeded model limits, requiring chunking and aggregation without biasing results. Avoiding noisy metrics: Simple correlation alone was misleading; we had to combine direction, magnitude, and confidence. UI clarity: The hardest part was deciding what not to show and framing the data as a clear narrative.
Accomplishments we're proud of
Turning abstract sentiment analysis into a testable, falsifiable signal Making misalignment auditable through real headlines Building a full ingestion → scoring → aggregation → visualization pipeline during a hackathon Designing a UI that tells a story instead of overwhelming users with charts Explicitly communicating uncertainty and data coverage
What we learned
Sentiment alone is cheap; sentiment reliability is hard Alignment matters more than raw positivity Clear narratives beat complex metrics Precomputing metrics is far more scalable than calculating them on every page load Strong framing can make existing data feel entirely new
What's next
Expand narrative sources (earnings calls, social platforms, analyst notes) Improve alignment math with volume- and confidence-weighted signals Add a full misalignment map across stocks and time Generate automatic explanations for why narratives failed Turn misalignment detection into alerts and weekly briefs Market Atlas isn’t about predicting markets. It’s about knowing when not to trust the story.
Market Atlas (Sentiment Reality)
Find false conviction in financial headlines.
Market Atlas measures when financial news sentiment diverges from actual stock price movement — and surfaces the exact days + headlines where the narrative failed.
YouTube Demo: Watch here
Why this is different
Most "stock sentiment" tools stop at what the news feels like.
Market Atlas asks a more practical question:
Can you trust the story right now?
It computes a Narrative Reliability Score over rolling windows (7/14/30 days), then shows:
- Where the narrative failed (specific dates where sentiment disagreed with price returns)
- Evidence (the actual headlines that drove the sentiment signal)
This makes the signal auditable, not just a black-box score.
What it does
For each tracked stock, Market Atlas:
- Ingests relevant news articles (NewsAPI)
- Extracts full text from each URL (newspaper3k)
- Scores sentiment using a finance-tuned HuggingFace model
- Fetches historical prices (yfinance)
- Computes daily aggregates and rolling alignment metrics
- Displays a single-page dashboard:
- Reliability score (Aligned / Noisy / Misleading)
- Misalignment days list (click to inspect)
- Recent headlines with sentiment labels
- Basic stock info + returns
Architecture (high-level)
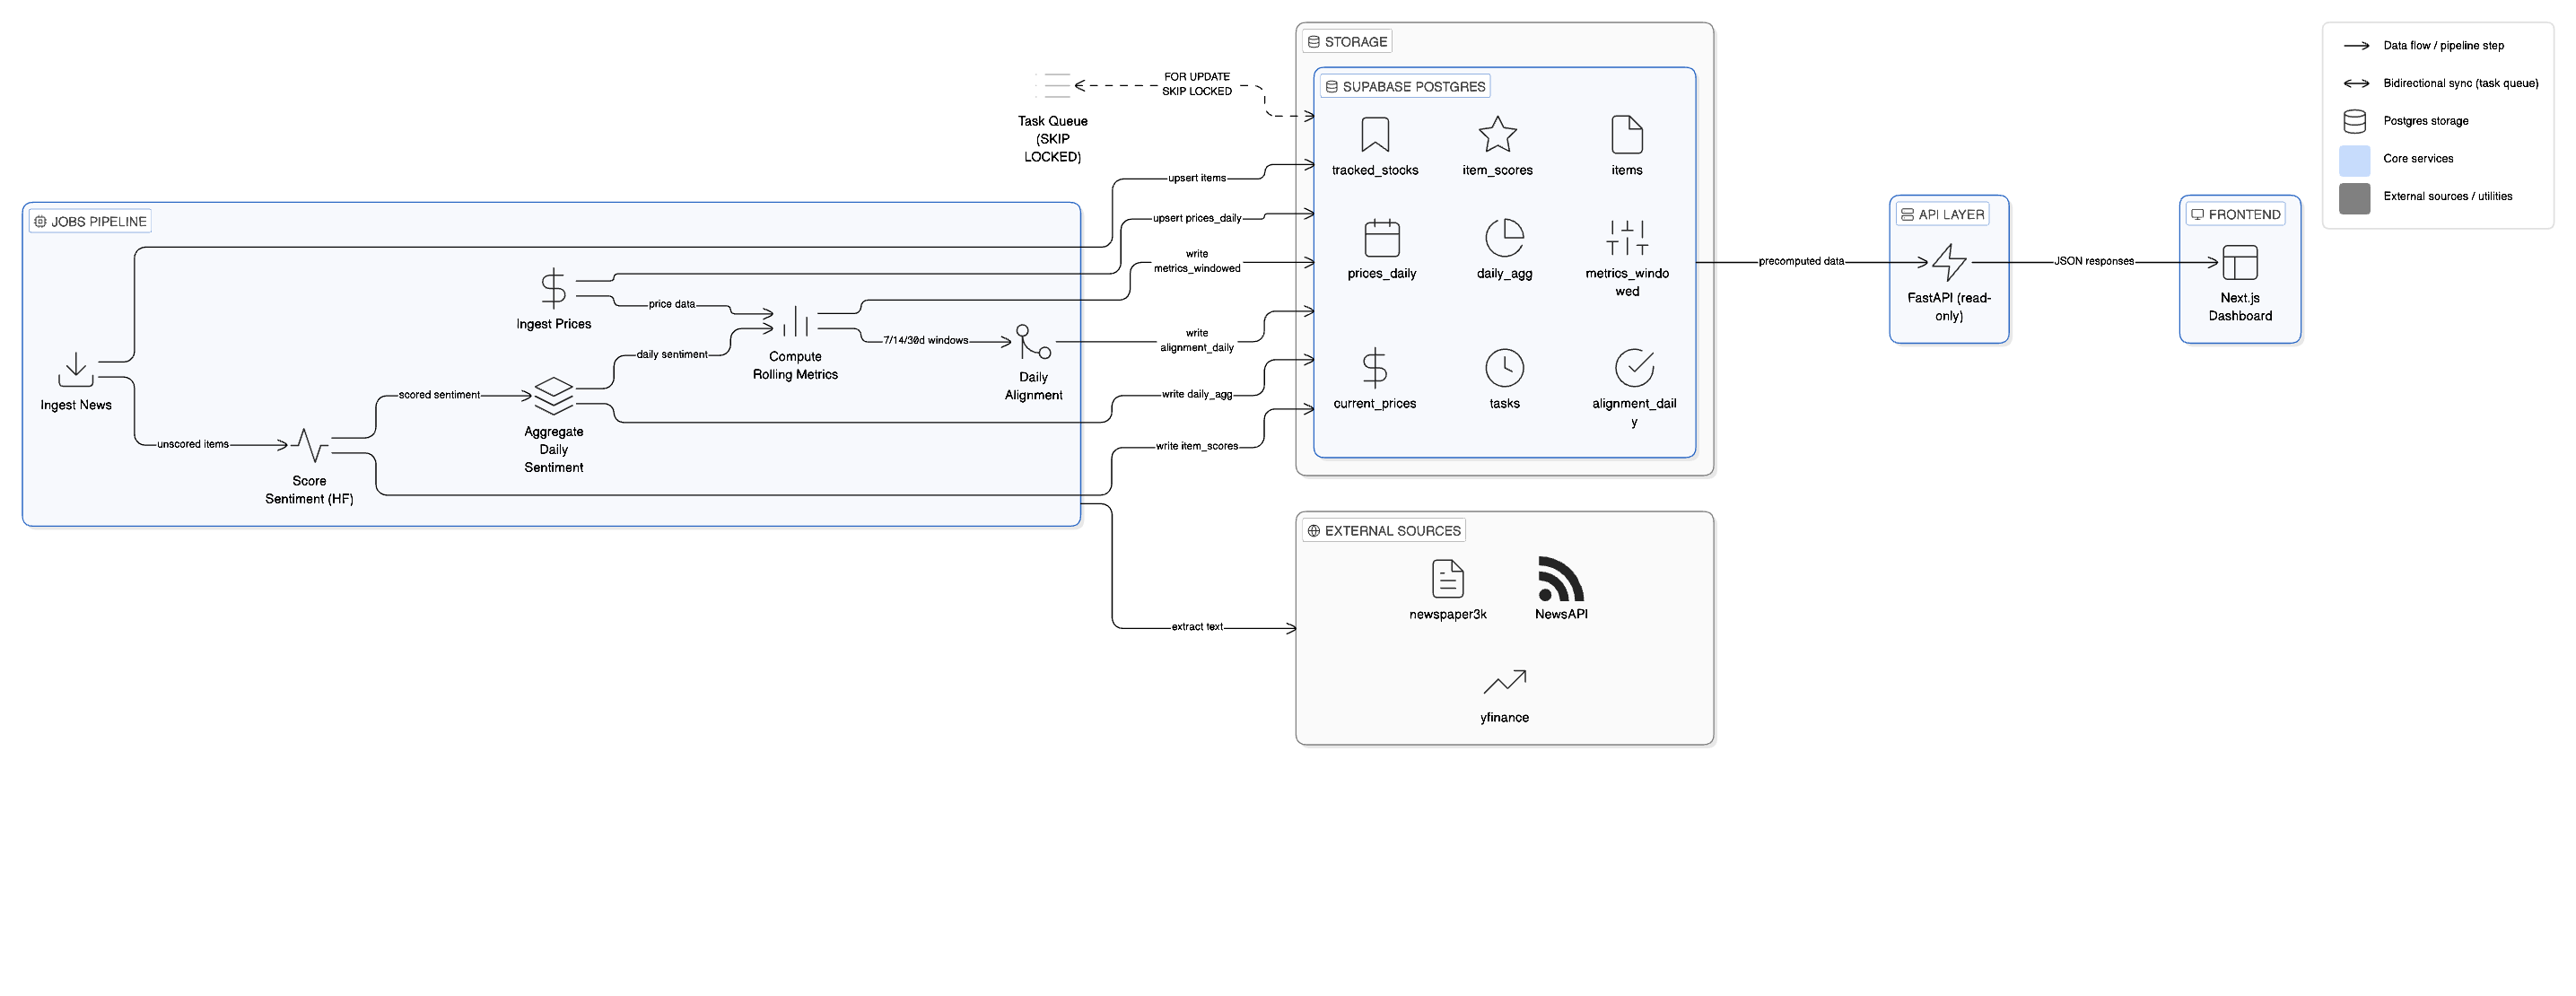
Strict separation of responsibilities:
jobs/— all external API calls, all ML inference, all DB writesapi/— read-only queries against Supabase Postgres, returns JSONweb/— dashboard UI, fetches from API only (no external data)
Tech stack
Backend
- Python + FastAPI
- Supabase Postgres
- Raw psycopg2 (no ORM)
ML / NLP
- Hugging Face Transformers
mrm8488/distilroberta-finetuned-financial-news-sentiment-analysis
Data sources
- NewsAPI (article metadata)
- newspaper3k (full text extraction)
- yfinance (historical prices)
Frontend
- Next.js App Router (single-page dashboard)
- TypeScript + React
- Material UI (MUI) dark theme
Core metric: Narrative Reliability
We compute narrative alignment over a rolling window using:
- Pearson correlation between daily sentiment and daily returns
- Directional match = fraction of days where sentiment sign matches return sign
Alignment score:
$$ A = 0.5 \times \rho(s, r) + 0.5 \times (2D - 1) $$
Where A = alignment, ρ(s, r) = Pearson correlation between sentiment and returns, D = directional match rate.
Interpretation:
- $\geq 0.3$ → Aligned
- $\leq -0.3$ → Misleading
- otherwise → Noisy
We also surface misalignment days where:
- |sentiment_avg| ≥ 0.05 and |return_1d| ≥ 0.5%
- sentiment sign disagrees with return sign
Sorted by strength: |sentiment| · |return|
Database schema (overview)
| Table | Purpose |
|---|---|
tracked_stocks | Watchlist tickers |
tasks | Postgres-backed job queue |
items | Raw news article metadata |
item_scores | Per-article ML outputs |
prices_daily | OHLCV + return_1d |
daily_agg | Daily sentiment rollups |
metrics_windowed | Rolling alignment metrics |
alignment_daily | Optional daily alignment system |
current_prices | Snapshot cache for latest price |
API surface (internal)
| Route | Method | Description |
|---|---|---|
/health | GET | Health check |
/api/stocks | GET | List tracked stocks |
/api/stocks | POST | Add ticker → enqueue BACKFILL task |
/api/stocks/refresh | POST | Enqueue REFRESH task |
/api/dashboard?ticker=X&period=N | GET | Main dashboard payload |
/api/headlines/by-date?ticker=X&date=YYYY-MM-DD | GET | Drilldown headlines for a day |
How "Refresh" works (end-to-end)
- User clicks Refresh in the dashboard
- Frontend calls:
POST /api/stocks/refresh {"ticker":"TSLA"}
- API enqueues a task in
tasks - Worker claims tasks with
FOR UPDATE SKIP LOCKED - Pipeline runs per ticker:
- ingest news → score new items → fetch prices → aggregate → compute metrics
- Frontend re-fetches dashboard and renders updated results
Note: the UI currently uses a fixed delay and re-fetches once. If the pipeline takes longer (e.g., heavy article extraction), the next refresh will reflect the newest state.
Notable design decisions
- No ML in the request path: the API never performs inference or external calls; heavy work runs in
jobs/. - Token limits handled properly: long articles are chunked with overlap; chunk results are aggregated into a single signed score.
- Idempotent ingestion: unique constraints +
ON CONFLICTprevent duplicates and make re-runs safe. - Auditable "signal": misalignment is tied to specific dates + headlines (not just an abstract number).
Known limitations
- Article extraction via newspaper3k can fail on paywalls or unusual markup
- NewsAPI free-tier limits historical backfill depth
- No websocket/streaming updates yet (refresh is queued + later re-fetched)
What's next
- Wire
DAILY_UPDATE_ALLto GitHub Actions cron for automatic freshness - Add a cross-ticker "misalignment map" view + filters
- Expand narrative sources (earnings calls, social, analyst notes)
- Improve alignment reliability with volume/confidence weighting and calibration
About this repo
This repository includes:
jobs/— ingestion + ML scoring + aggregation pipeline (writes to DB)api/— FastAPI read-only APIweb/— Next.js dashboard UI
Analysis
View
Metric
- 16
- 15
- 10
- 1


Figures cover GitHub contributors during the hackathon window. A co-authored commit counts in full for each author, so per-member totals add up to more than the whole-team figures.
Technology
- CSSIn code
- FastAPIIn code
- Hugging FaceIn code
- Next.jsIn code
- PythonIn code
- PyTorchIn code
- ReactIn code
- SQLIn code
- Tailwind CSSIn code
- TypeScriptIn code
- PostgreSQLClaimed
10 of 11 appear in the indexed code. 1 claimed on Devpost could not be matched to code, which may simply mean the tool leaves no trace in the repository.
AI coding agents
- Claude CodeConfig · Commits
Detected from committed agent config files and commit authorship. Absence of a signal is not proof an agent was unused.
Codebase size
Source size
196 KB
Source files
65
Counts recognized source files only; vendored directories, binaries and lockfiles are excluded, so this is smaller than the repository on disk.
Repository
SashaSkind/Market-Atlas
80 files · 483 KB · @ f8362cc
Structure
Interface
18 files · 23%Screens, components and styles rendered to the user.
API & routing
14 files · 18%Request entry points: routes, handlers and controllers.
Application logic
5 files · 6%Domain rules, services and shared utilities.
Background jobs
20 files · 25%Work run outside a request: tasks, workers and schedules.
Data & schema
1 file · 1%Schema definitions, migrations and data access.
Supporting
Layers are inferred from where files sit in the tree, not from reading the code. A project that names its directories unconventionally will read oddly here — open the file browser to check anything the diagram implies.
Languages
- Python58%
- TypeScript33%
- Markdown6%
- SQL3%
- CSS0%
- YAML0%
Share of indexed source by file size. Binary and vendored files are excluded.
Dependencies
sentiment-reality/web/package.json
npm · 15- @emotion/react
- @emotion/styled
- @mui/material
- @mui/material-nextjs
- next
- react
- react-dom
- recharts
- +7 more
sentiment-reality/jobs/requirements.txt
pypi · 14- feedparser
- lxml
- lxml_html_clean
- newspaper3k
- nltk
- numpy
- pandas
- psycopg2-binary
- python-dateutil
- python-dotenv
- requests
- torch
- transformers
- yfinance
sentiment-reality/api/requirements.txt
pypi · 5- fastapi
- psycopg2-binary
- pydantic
- python-dotenv
- uvicorn
Declared in the repository’s manifests at the indexed commit. A declared package is not proof it is used, and runtime dependencies are listed first.
This project’s features have not been analysed yet.
Export this project's context (description, README, evidence, key source files) to chat with an AI agent elsewhere.