Project Info
This project did not submit a demo video on Devpost.
Inspiration
One day after business class, we realized just how boring financial statements sounded in class (income, asset, and balance sheets were). Many would not think of looking at financial statements before investing in a company, due to the difficulty of comprehending what the statement means without prior knowledge, even though the statement could provide very crucial indicators for how a company is doing. Utilizing an AI agent would increase financial statement accessibility for a dataset that was meant to be accessible.
What it does
Our program contextualizes financial statements from time series bar graphs of financial statement data using AI upon cursor hover of a graph, it provides both micro (company & industry) and macroeconomic (Fed policy & global) contexts.
How we built it
SEC data pulled through financialmodelingprep transformed with pandas into graphs hosted on streamlit integrated Groq api (mixtral-8x7b-32768, "Mixtral of experts") to provide AI context on hover for graphs.
Challenges we ran into
One big challenge was getting a website with data up and running. Initially, we wanted to do SQL calls on a dolthub data and integrate it with a website built in reflex.dev, but we couldn't get the SQL calls to return any data at all. We spent a lot of time debugging but never got it to work which is why we switched to another API (financialmodelingprep) to call data, despite it having a shorter time series. The most challenging thing was probably figuring out how to get the AI to function. We have never done an AI API call before, so setting it up required countless hours of consulting GPT and the internet to discover the easiest way we could get it work with our site.
Accomplishments we're proud of
We're proud that we got something within our initial vision and built something out with newbies 🔥 Here’s to many more projects!
What we learned
We learnt to type up the devpost locally because the page crashing literally wiped out our first iteration that we typed up. We also learnt that FUD regarding LLMs replacing programmers might just be what it is: FUD. We were basically three non-technicals and found it almost impossibly hard to create something like we envisioned with GPT. We thought we could prompt it with examples and specific contexts and it would build something extremely sleek, but most of the code it generated didn't run at all, so we had to watch youtube tutorials.
What's next
Switch dataset from financialmodelingprep to dolthub (larger range of data + free) and pull data using SQL. Better UI, improve visibility of graphs, customizability of layout. Improving AI model for narrower context and accuracy. Adding more customizability for graphs (line, bar, etc), incorporate a automatic sankey style diagram generation for income statements (which is cool to have), and make the AI generated text be less intrusive (move it to bottom left corner and have it disappear upon clicking outside the context window) Not financial advice, please perform your own due dilligence. AI could hallucinate as project was bootstrapped in a day. Utilize with soft caution!
Financ!al
(This was a CalHacks2024 Project: https://devpost.com/software/ai-powered-context-generator-for-financial-statements)
Financial statements contain information critical to determining a company’s health. AI generated context makes information accessible, analyzing financial and economic contexts to explain trends.
The program contextualizes financial statements from time series bar graphs of financial statement data using AI upon cursor hover of a graph, it attempts to provides both micro (company & industry) and macroeconomic (Fed policy & global) contexts.
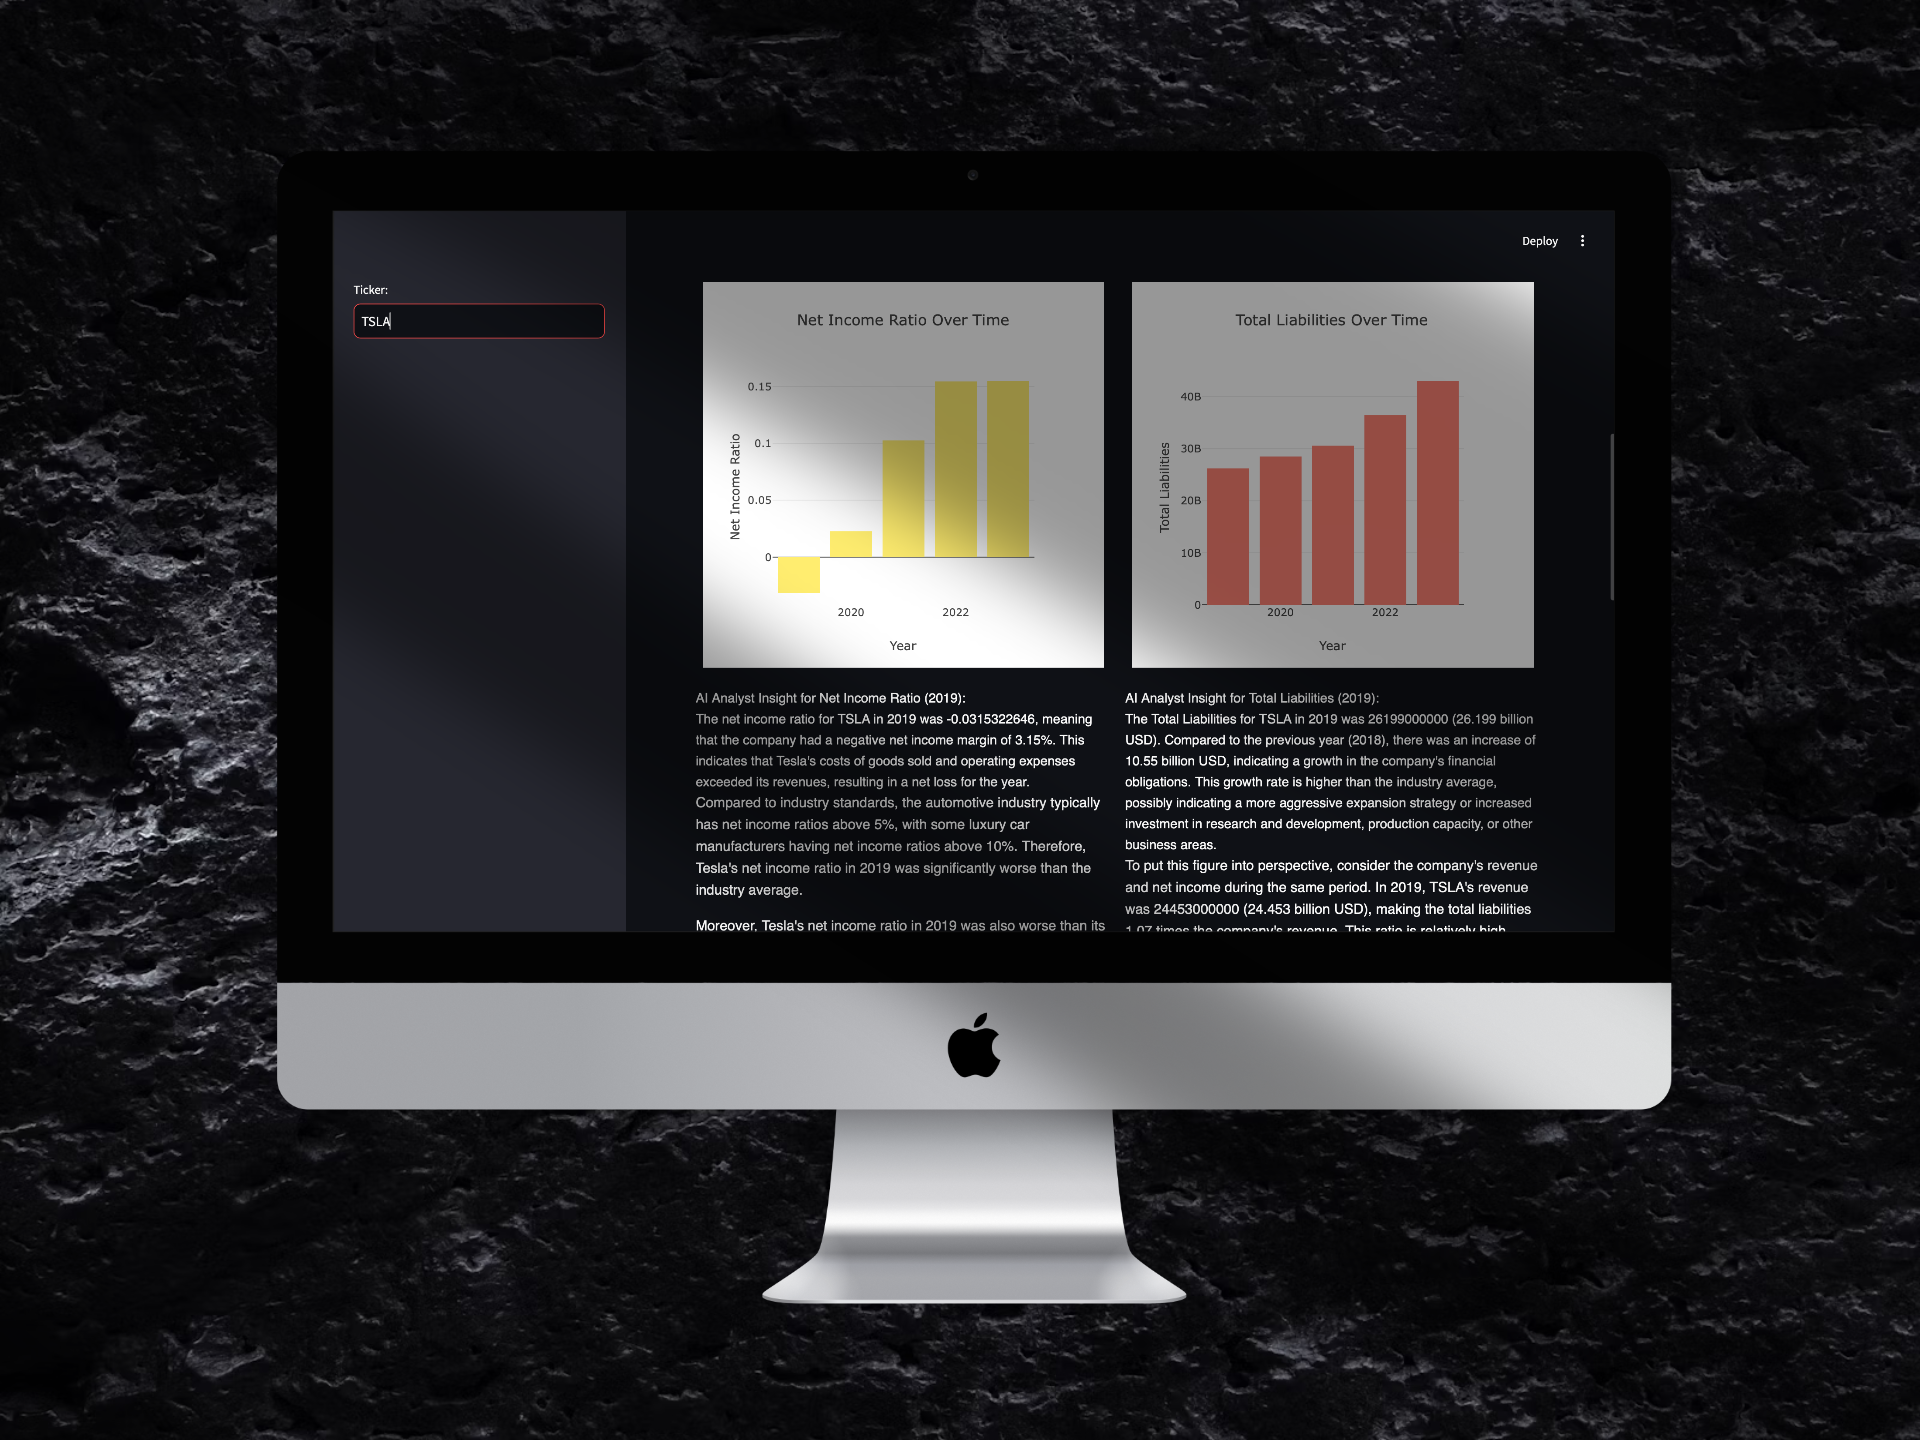 Financ!al: Sleek, Easy, and Comprehensive
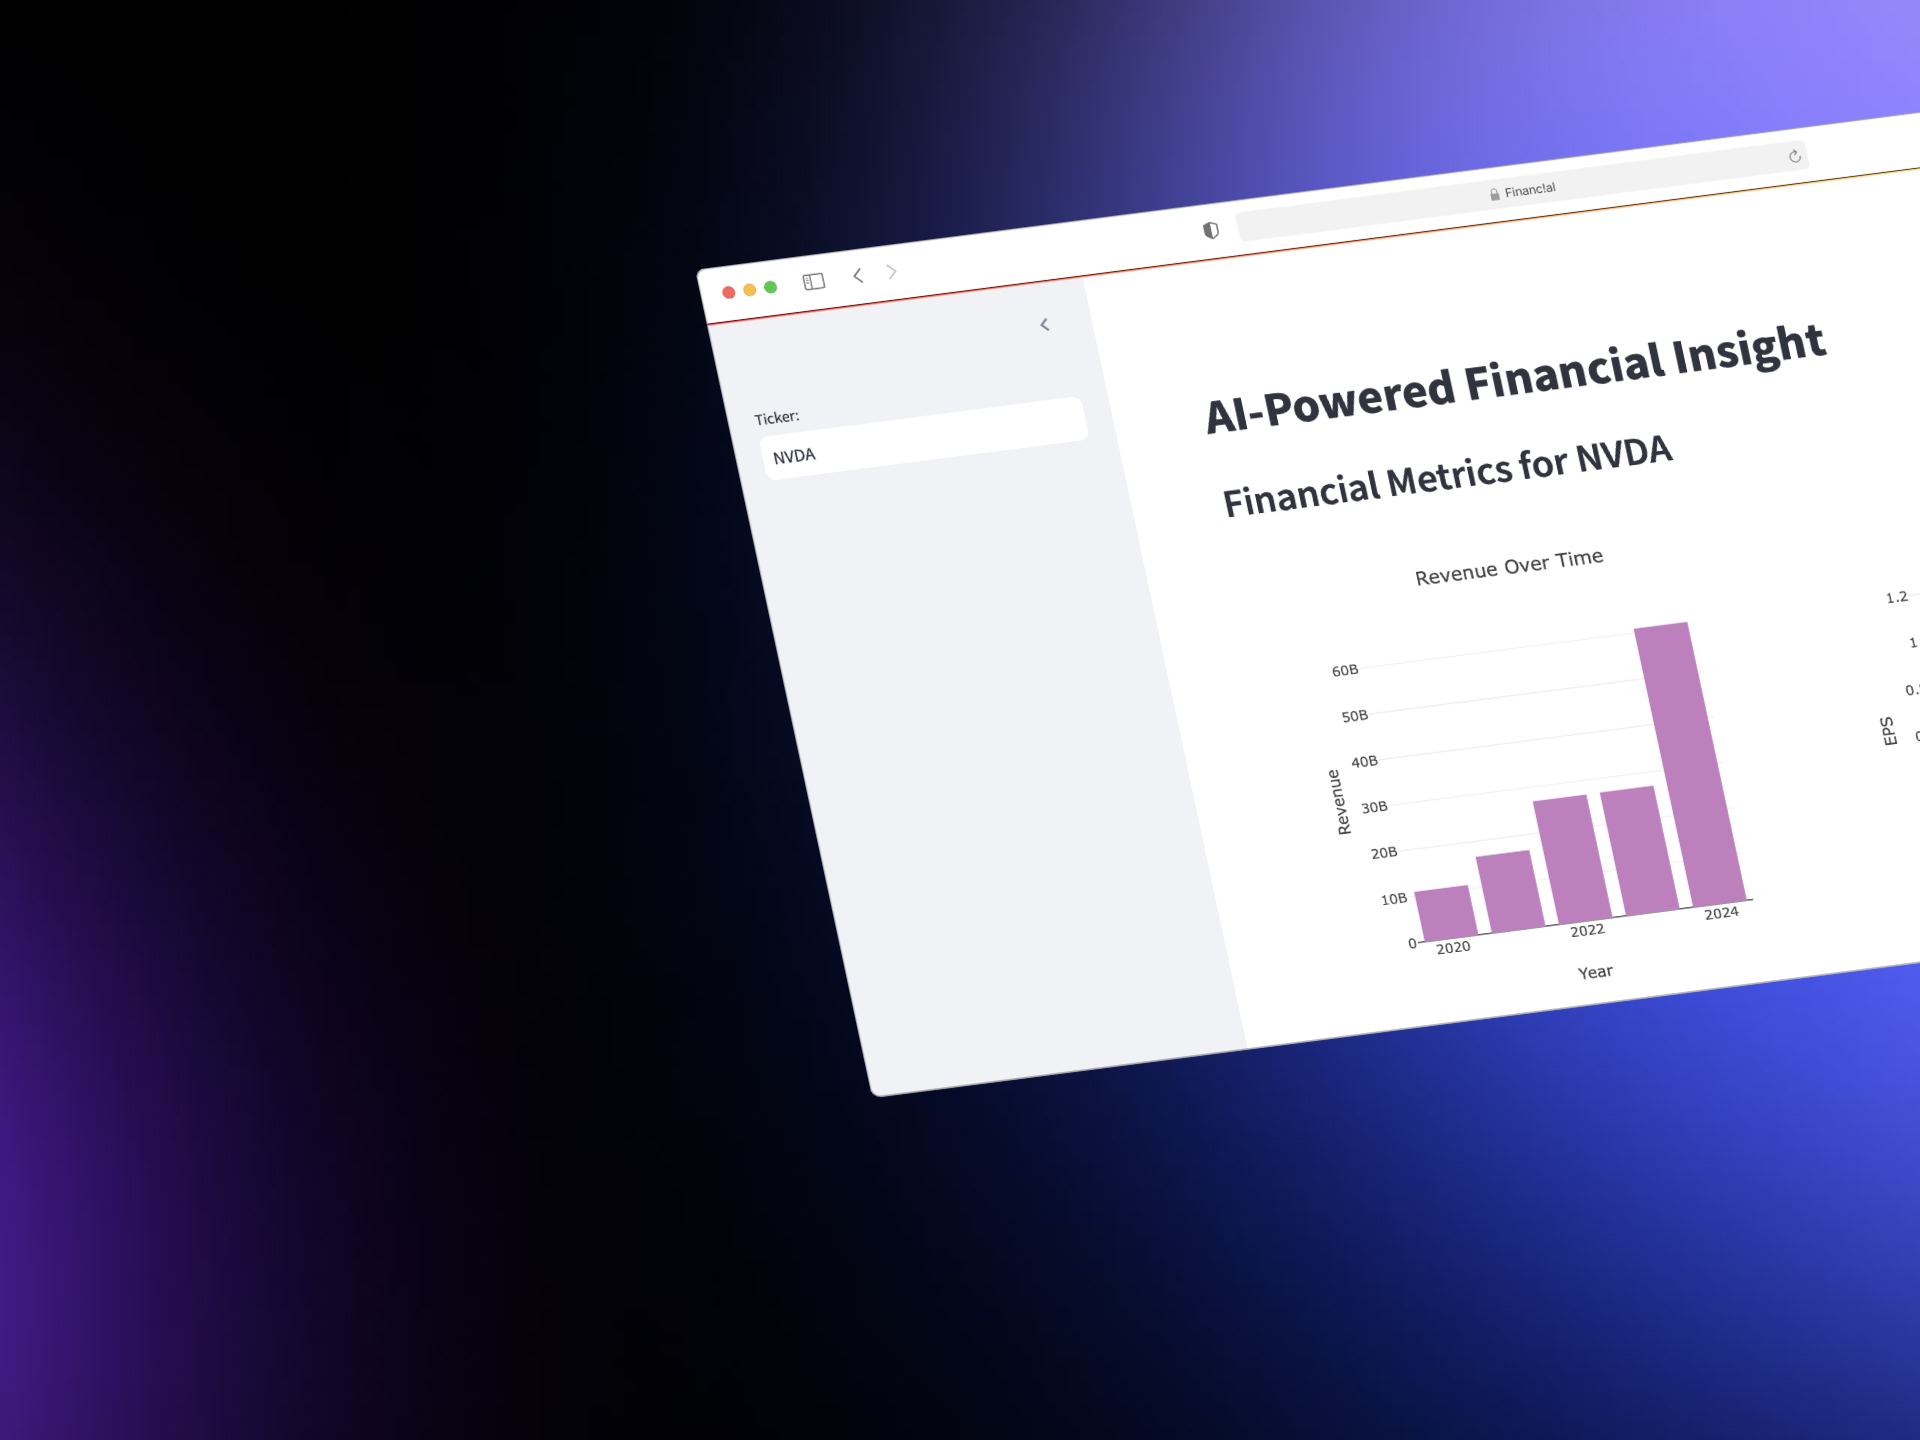 4000+ Comapanies Available at Your Fingertips: Just Type in a Ticker
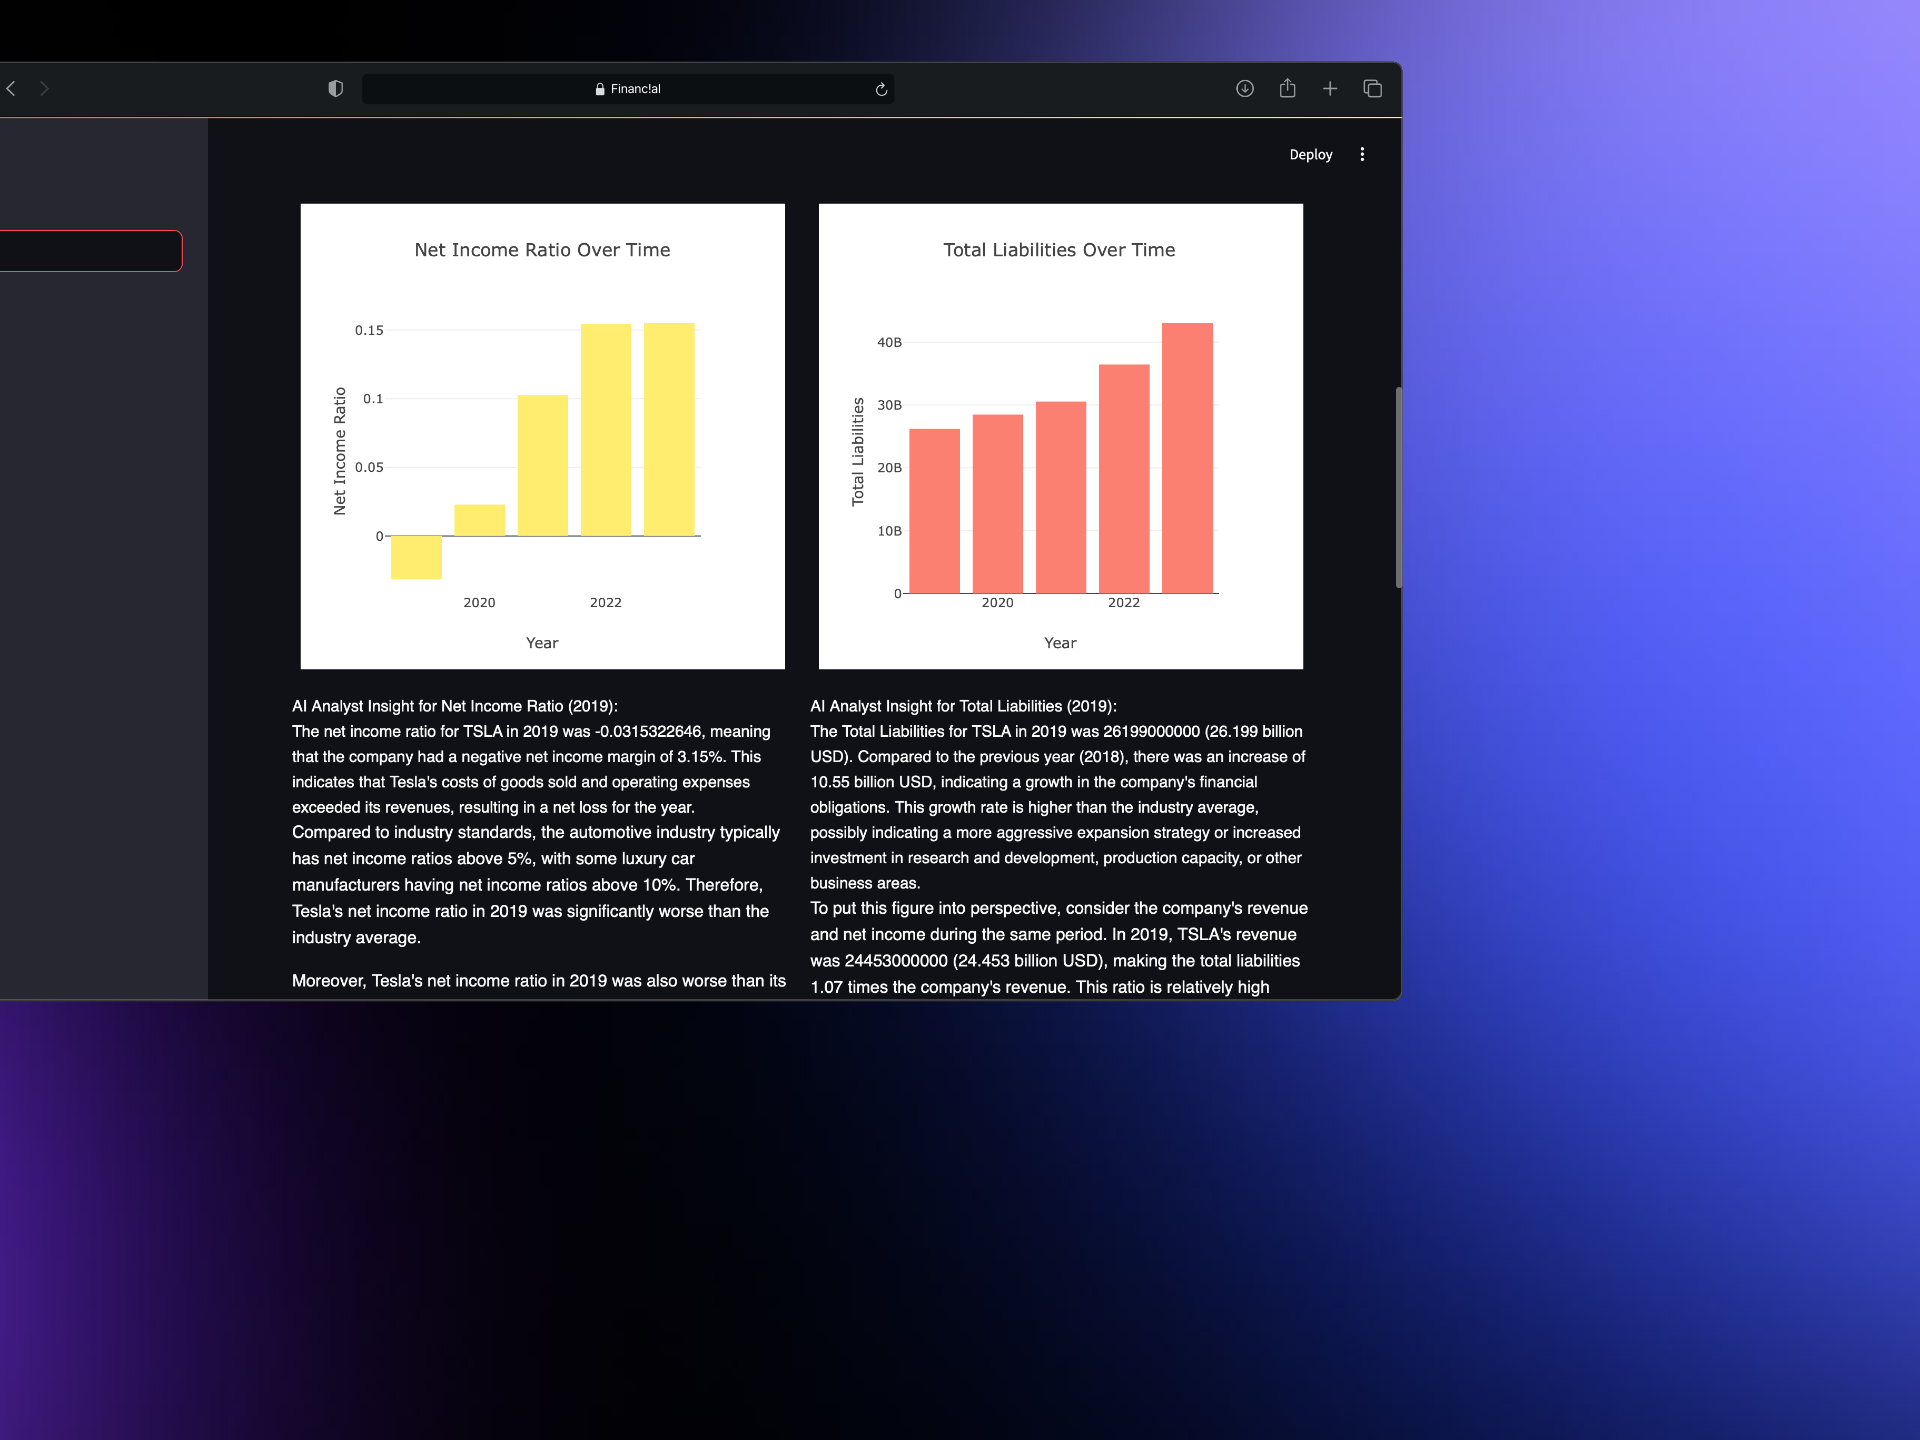 AI Analyst Provides Relevant and Critical Information
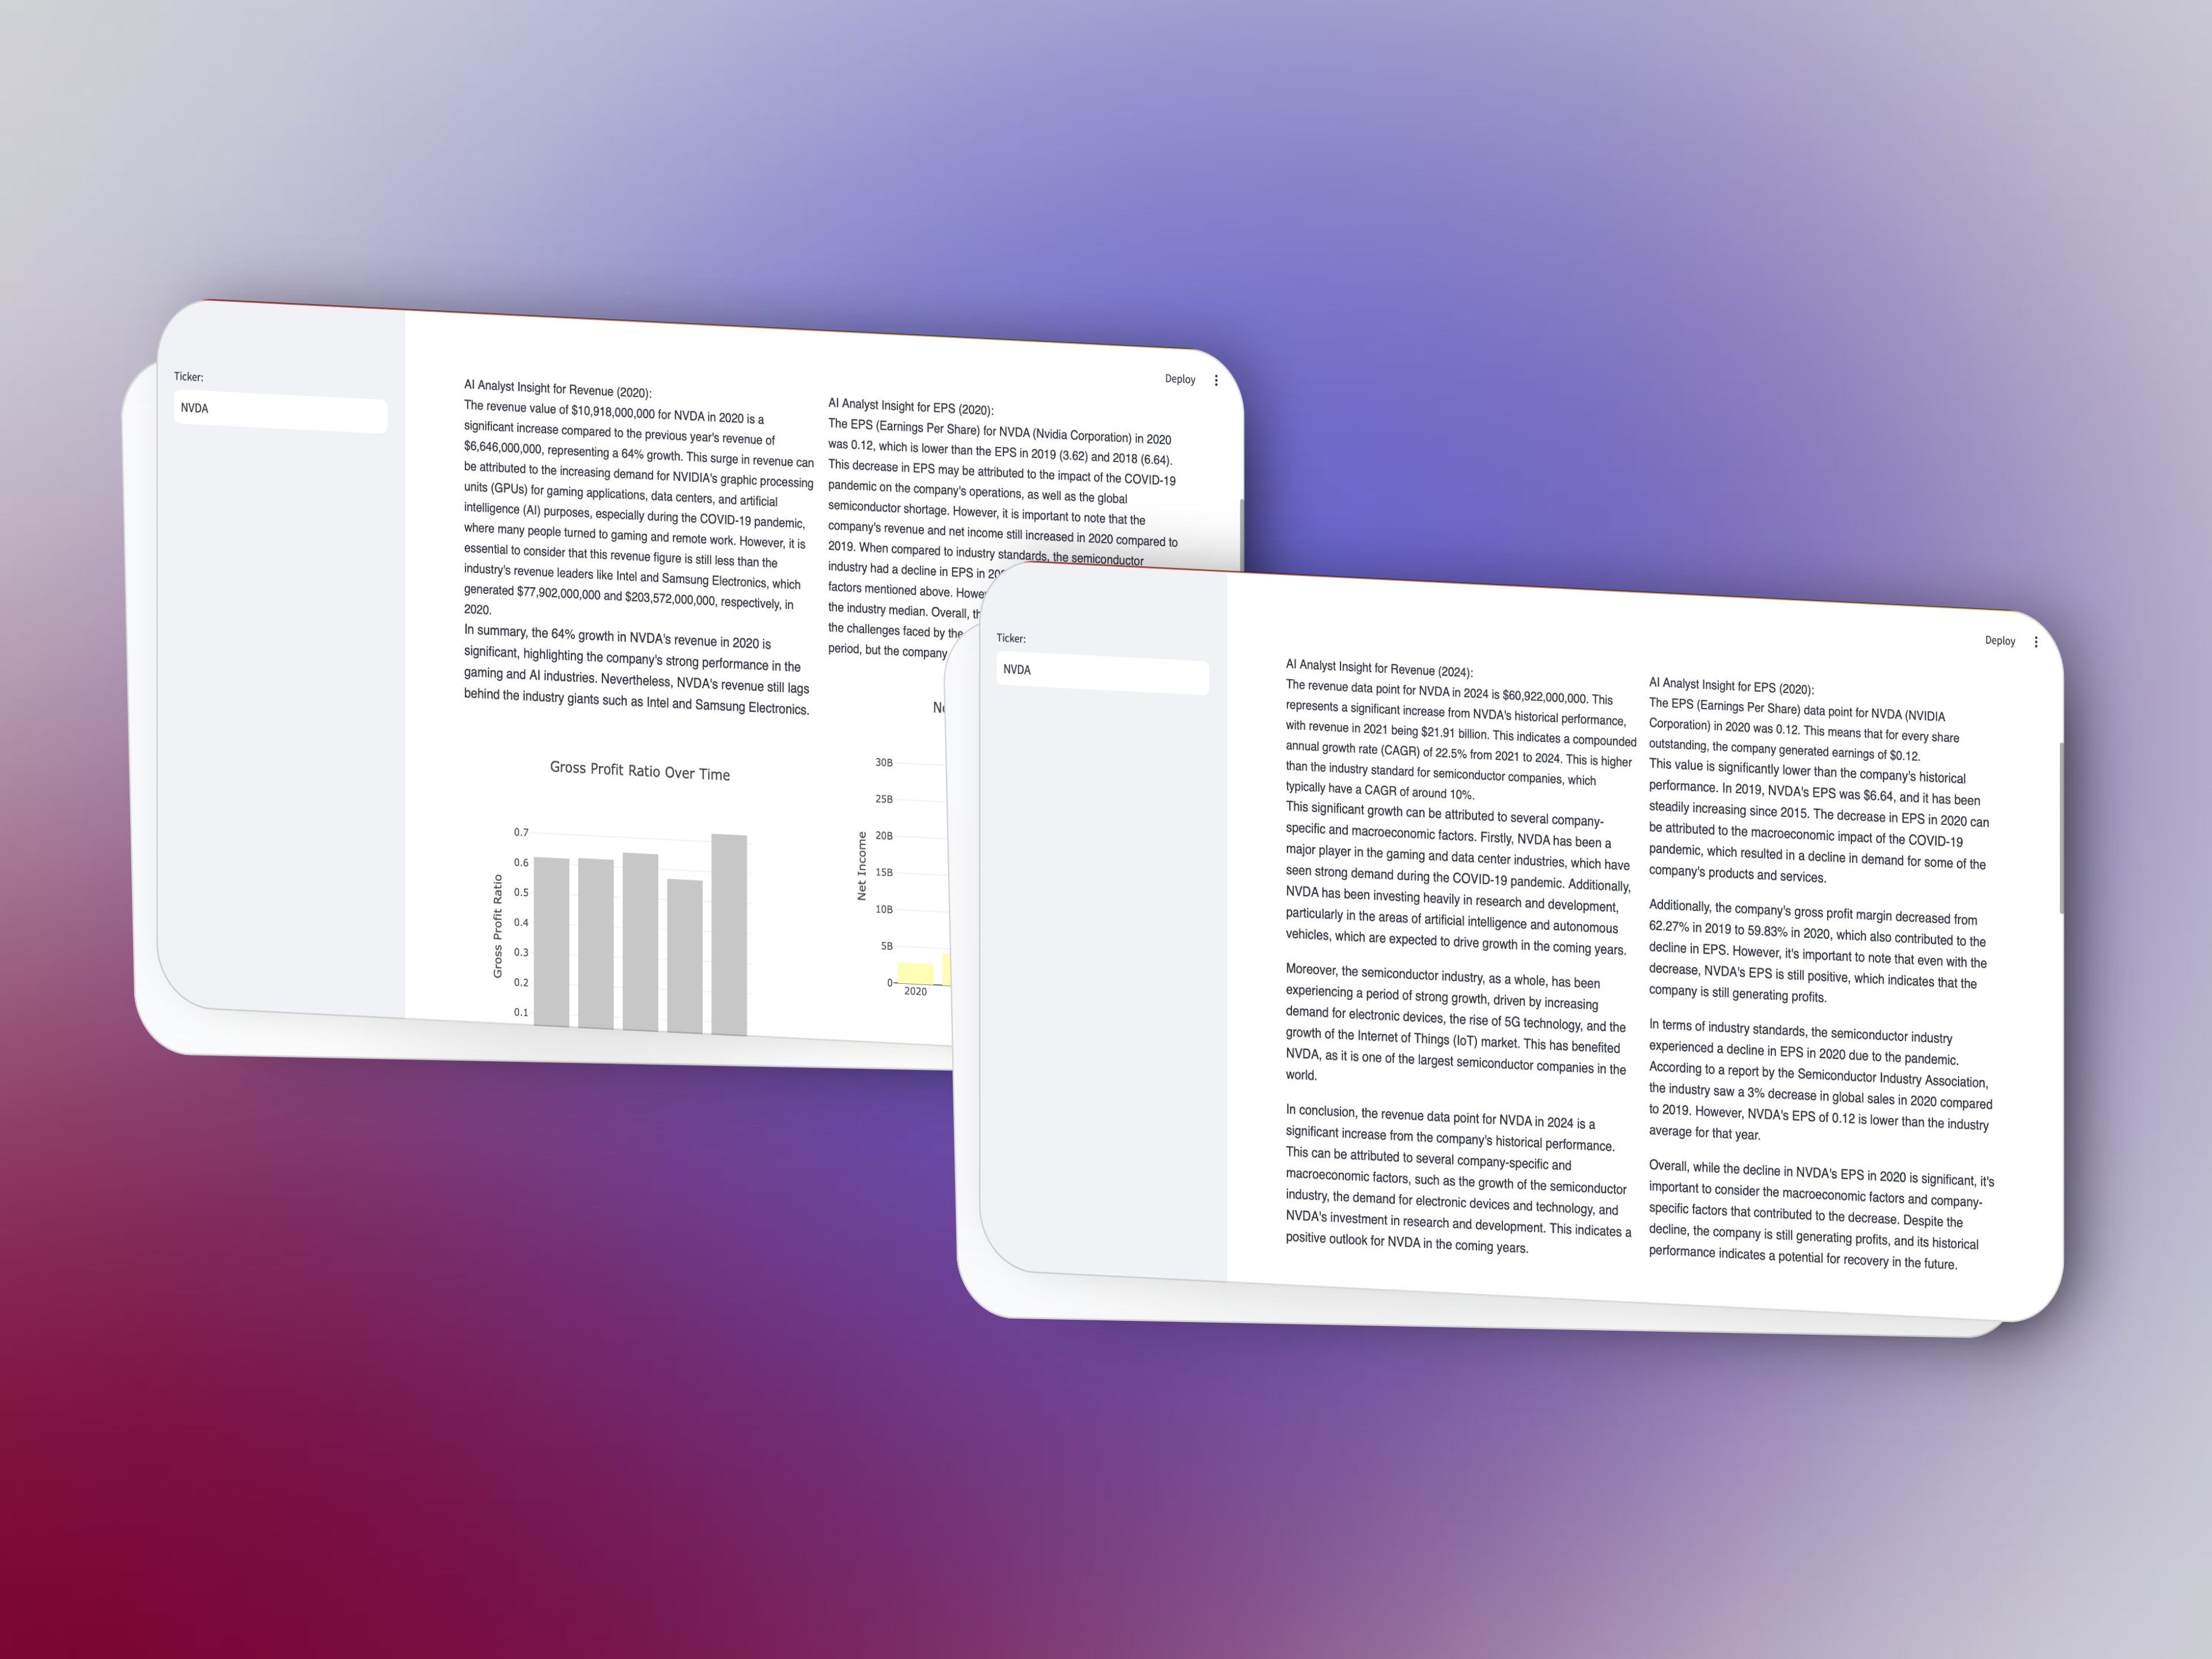 Compare Trends Overtime: Determine Bubbles Before Investing
Analysis
View
Metric
- 10
- 6


Figures cover GitHub contributors during the hackathon window. A co-authored commit counts in full for each author, so per-member totals add up to more than the whole-team figures.
Technology
- CIn code
- C++In code
- CSSIn code
- HTMLIn code
- JavaScriptIn code
- PostgreSQLIn code
- PythonIn code
- StreamlitIn code
8 of 8 appear in the indexed code.
AI coding agents
No AI coding agent signals were found in this repository.
Detected from committed agent config files and commit authorship. Absence of a signal is not proof an agent was unused.
Codebase size
Source size
147 MB
Source files
20,442
Counts recognized source files only; vendored directories, binaries and lockfiles are excluded, so this is smaller than the repository on disk.
Repository
Ky13C/Financ.Al
4,000 files · 98.2 MB · @ 8c38db2
Structure
Interface
8 files · 0%Screens, components and styles rendered to the user.
API & routing
6 files · 0%Request entry points: routes, handlers and controllers.
Application logic
2,179 files · 54%Domain rules, services and shared utilities.
Data & schema
45 files · 1%Schema definitions, migrations and data access.
Supporting
Layers are inferred from where files sit in the tree, not from reading the code. A project that names its directories unconventionally will read oddly here — open the file browser to check anything the diagram implies.
Languages
- Python82%
- JavaScript17%
- C1%
- Markdown0%
- Shell0%
- C++0%
- Other (2)0%
Share of indexed source by file size. Binary and vendored files are excluded.
Dependencies
myenv/lib/python3.9/site-packages/pandas/pyproject.toml
pypi · 83- numpy
- python-dateutil
- pytz
- tzdata
- +79 more
myenv/lib/python3.9/site-packages/jupyterlab_plotly/labextension/package.json
npm · 23- @jupyter-widgets/base
- @jupyterlab/rendermime-interfaces
- @lumino/messaging
- @lumino/widgets
- lodash
- plotly.js
- +17 more
myenv/share/jupyter/labextensions/jupyterlab-plotly/package.json
npm · 23- @jupyter-widgets/base
- @jupyterlab/rendermime-interfaces
- @lumino/messaging
- @lumino/widgets
- lodash
- plotly.js
- +17 more
requirements.txt
pypi · 10- groq
- os
- pandas
- plotly
- plotly.express
- plotly.graph_objects
- random
- requests
- streamlit
- streamlit_plotly_events
Declared in the repository’s manifests at the indexed commit. A declared package is not proof it is used, and runtime dependencies are listed first.
This repository has more files than are indexed here, so the diagram and browser show a partial tree. Open it on GitHub for the complete structure.
This project’s features have not been analysed yet.
Export this project's context (description, README, evidence, key source files) to chat with an AI agent elsewhere.